Feedback
Business Analytics and Intelligence with CrateDB
Business analytics applications and frameworks, which can be used together with CrateDB.
Microsoft Power BI
Power BI Desktop is a powerful business intelligence tool that provides a set of data analytics and visualizations. Using Power BI Desktop, users can create reports and dashboards from large datasets.
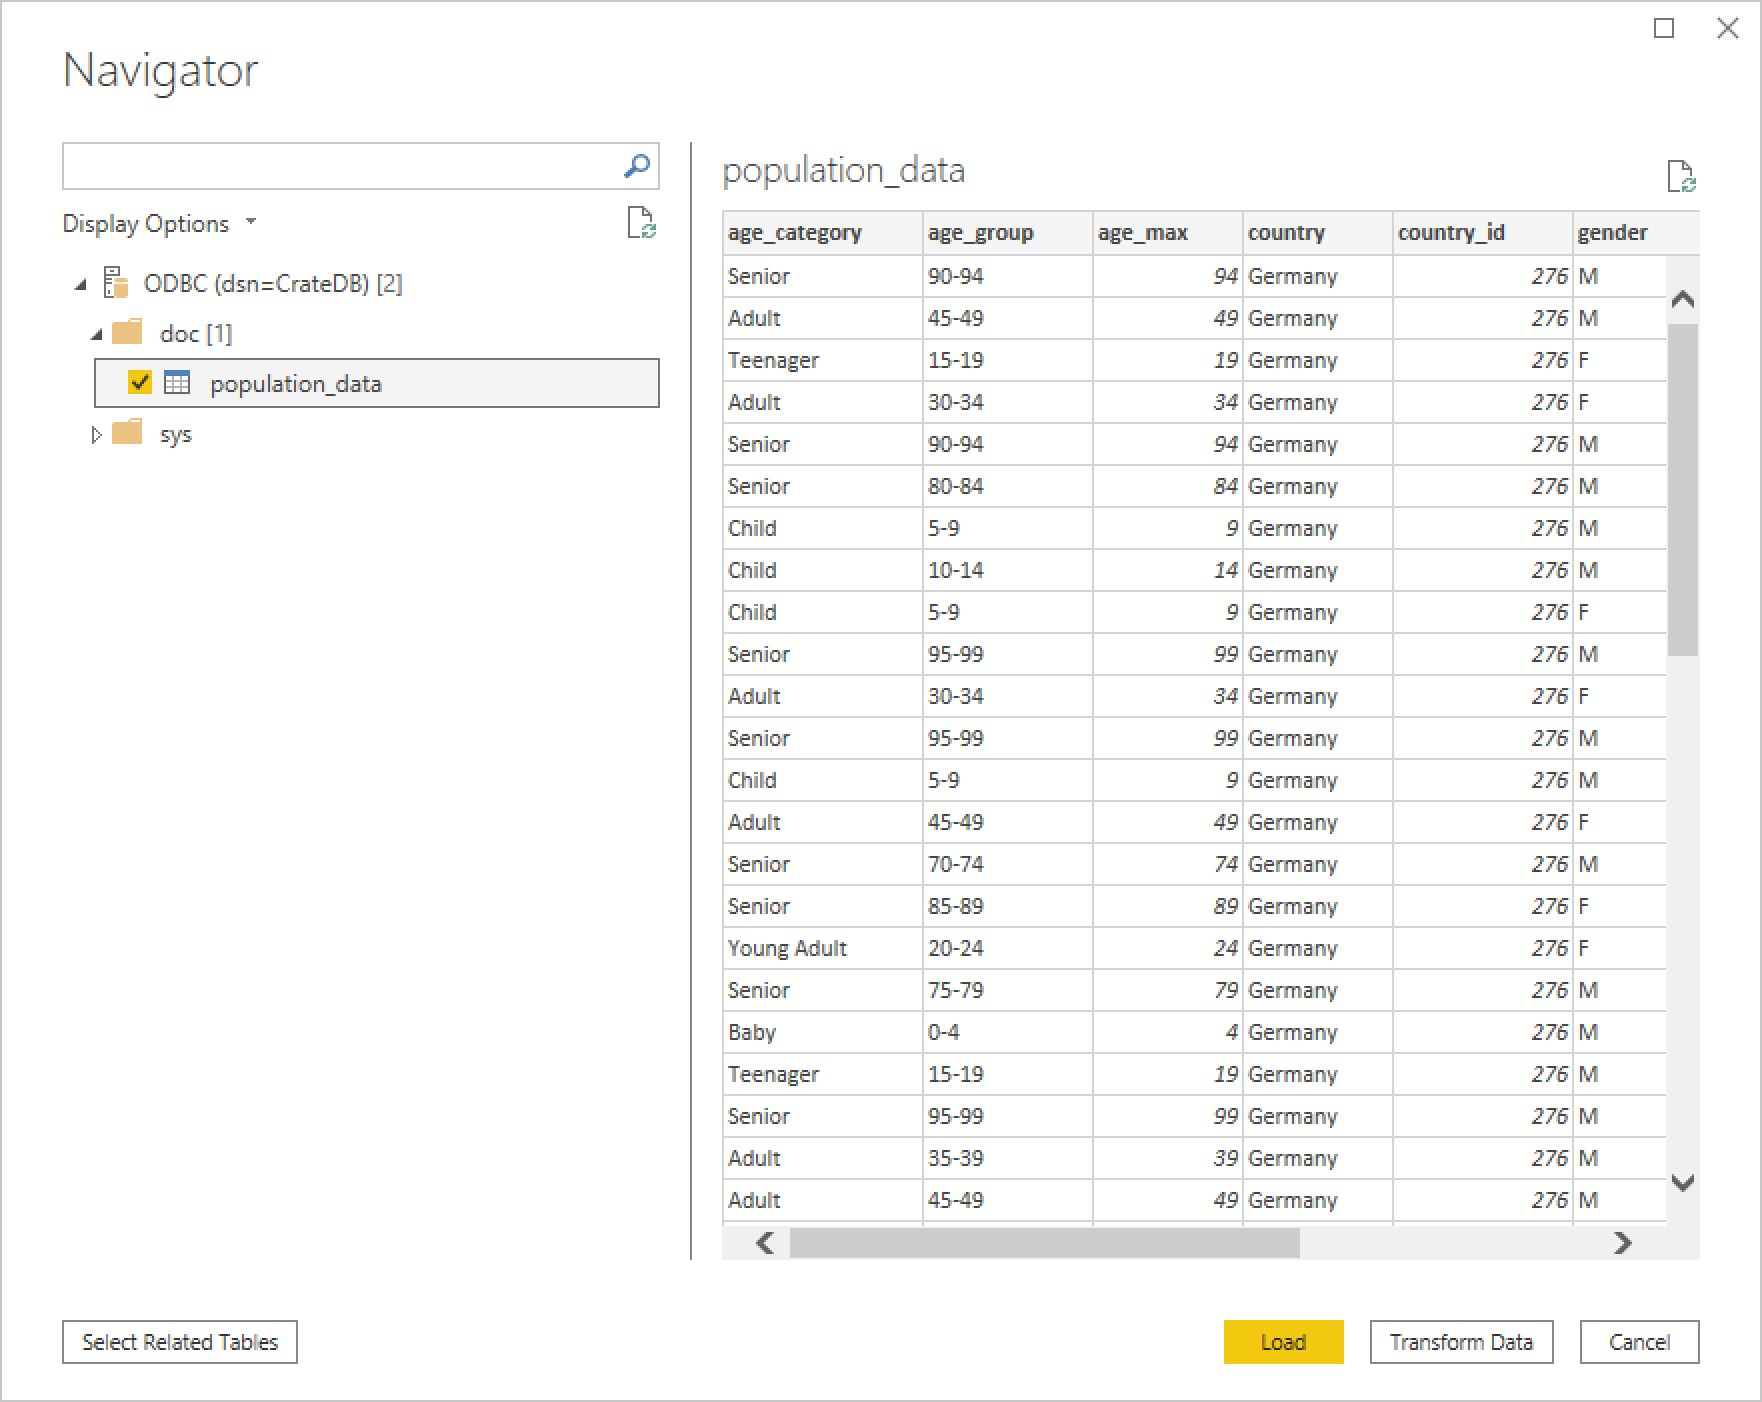
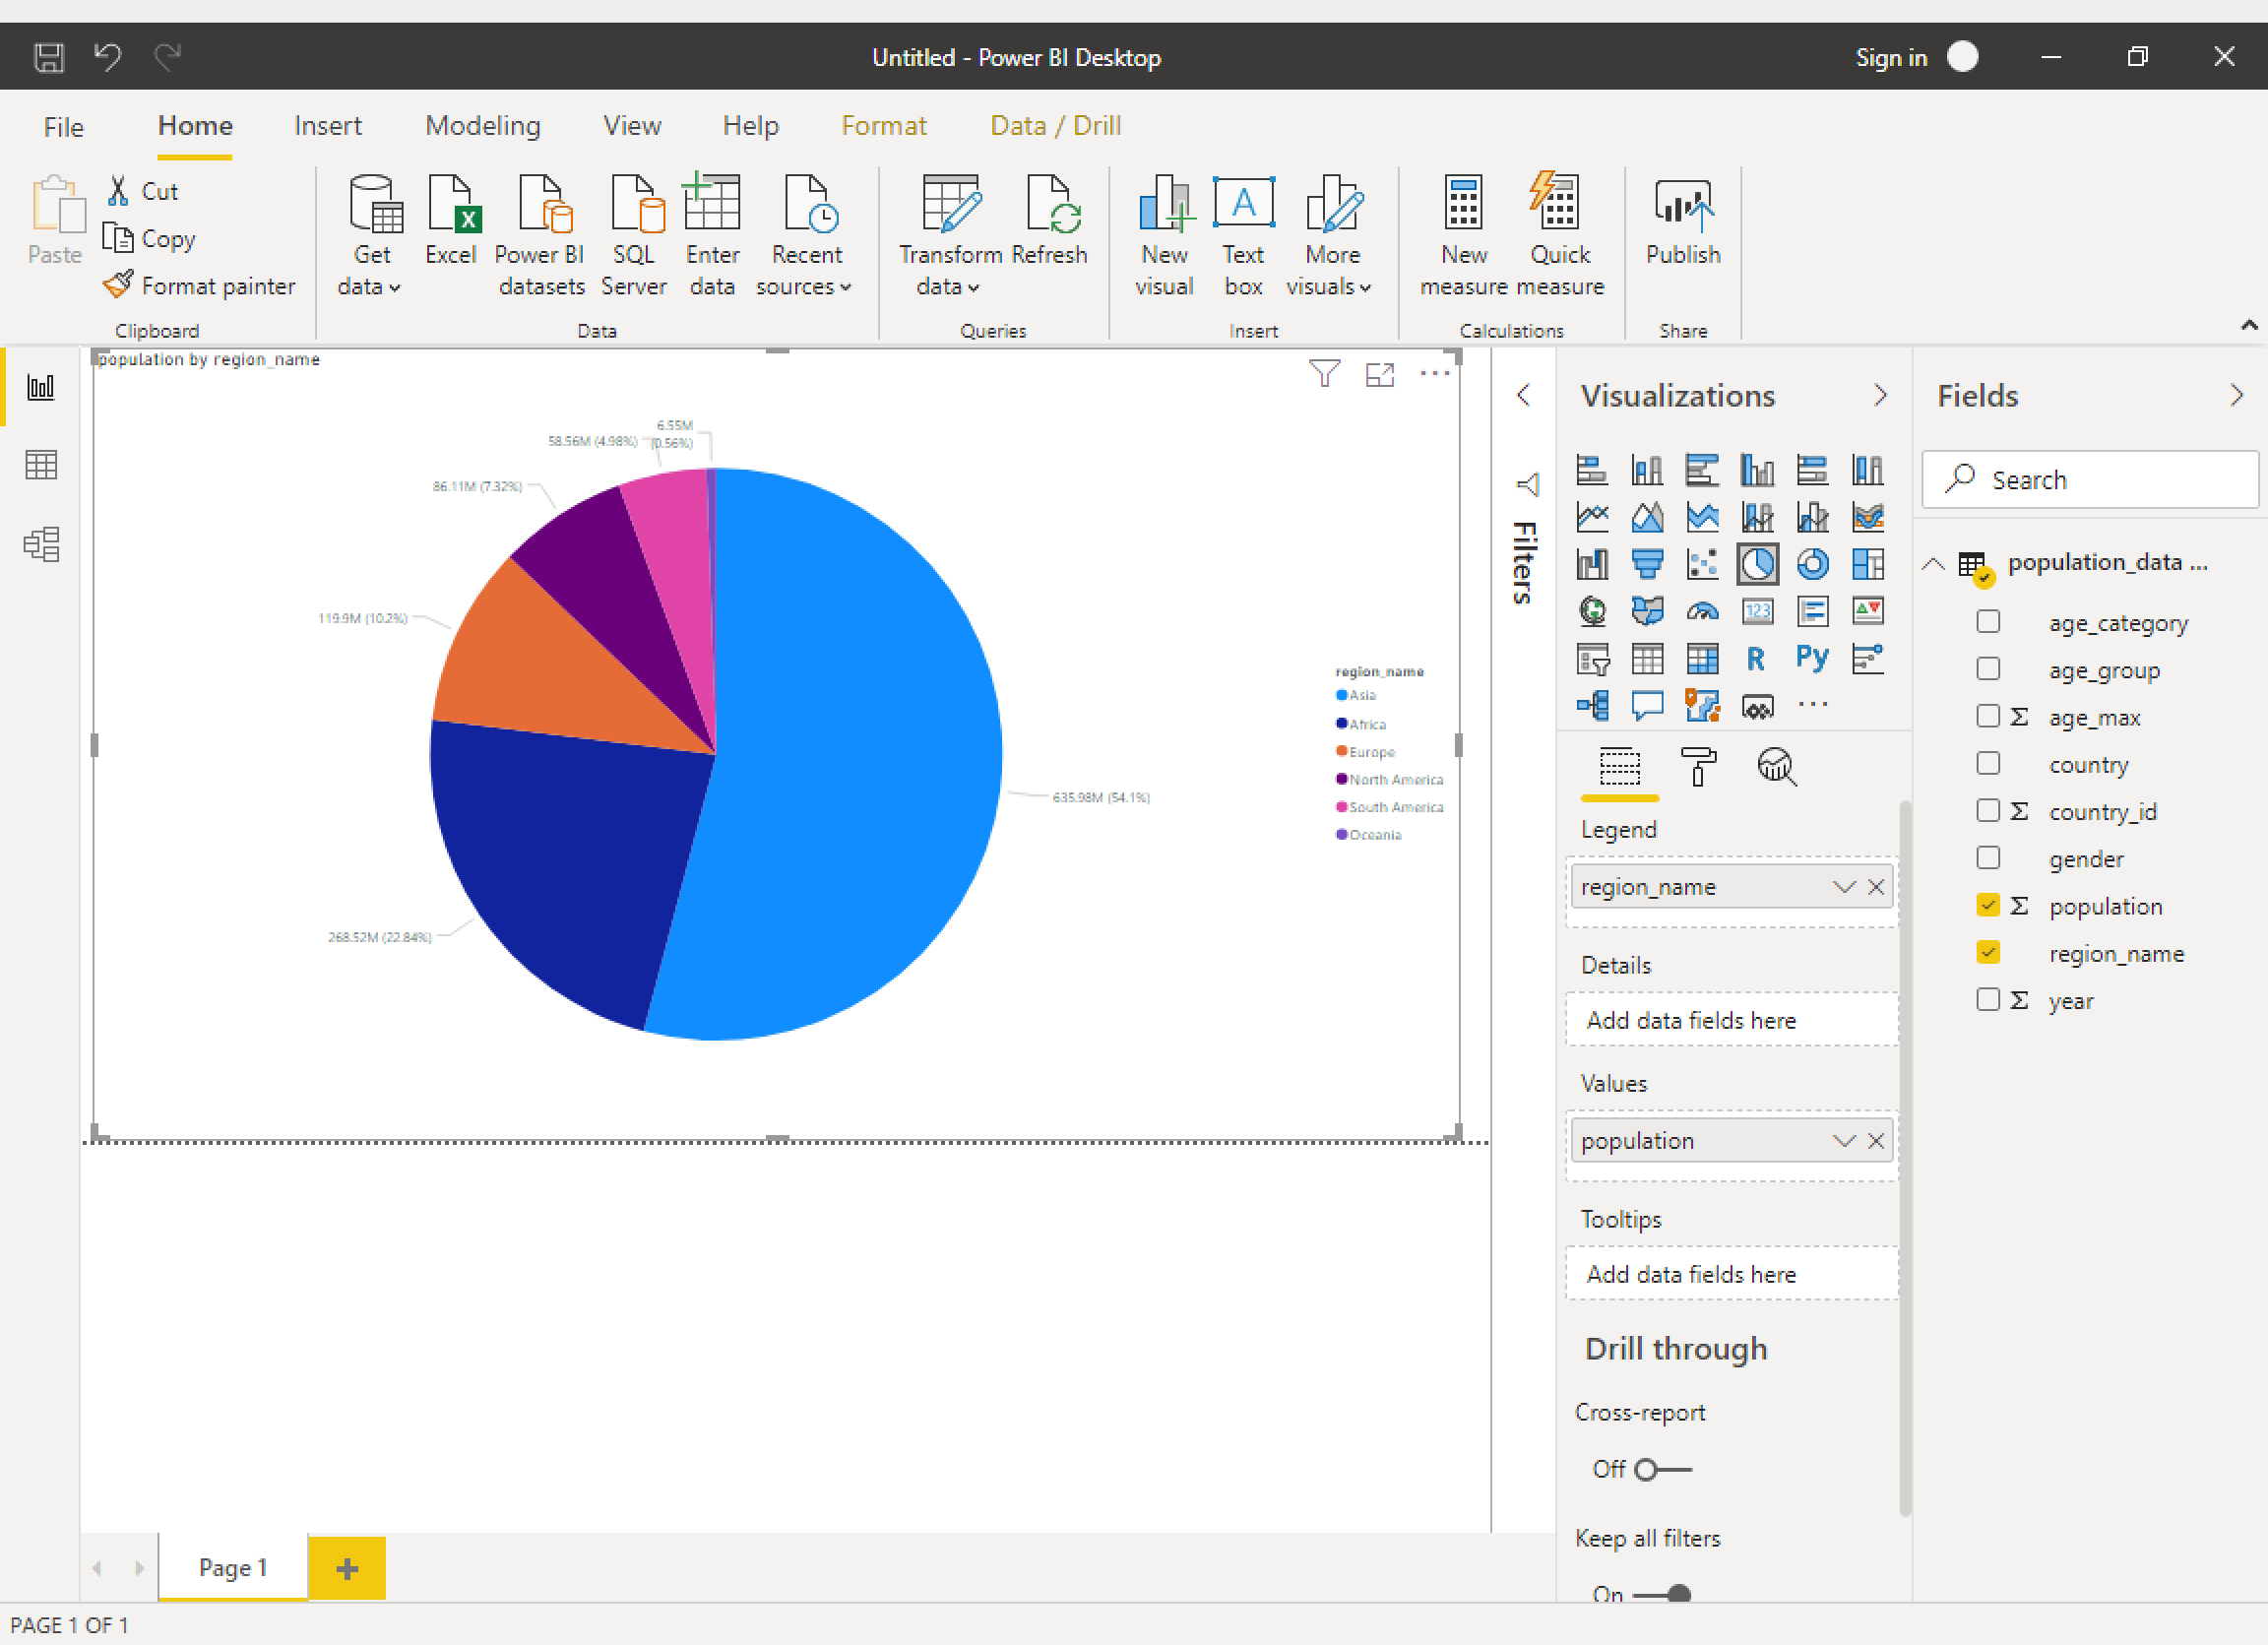
For connecting to CrateDB with Power BI, you can use the Power Query PostgreSQL connector. Earlier versions used the PostgreSQL ODBC driver. Reports with CrateDB and Power BI Desktop walks you through the process of configuring that correctly.
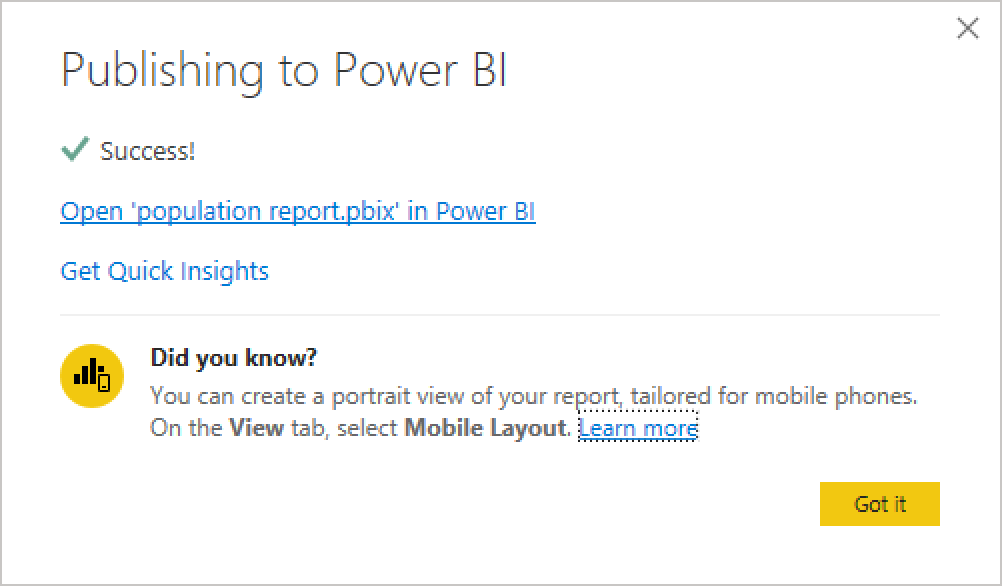
Power BI Service is an online data analysis and visualization tool, making it possible to publish your dashboards, in order to share them with others. Real Time Reports with CrateDB and Power BI has a corresponding tutorial.
See also
Rill
Rill is an open-source operational BI framework for effortlessly transforming data sets into powerful, opinionated dashboards using SQL.
Unlike most BI tools, Rill comes with its own embedded in-memory database. Data and compute are co-located, and queries return in milliseconds. So you can pivot, slice, and drill-down into your data instantly.
Rill takes a modern approach to Business Intelligence (BI), which is starting to leverage software engineering principles by implementing the concept of BI as code.
This methodology allows for versioning and tracking, thus improving collaboration on BI projects using code, which is more efficient and scalable than traditional BI tools, also breaking down information and knowledge barriers.
Rill’s design principles
Feels good to use – powered by Sveltekit & DuckDB = conversation-fast, not wait-ten-seconds-for-result-set fast
Works with your local and remote datasets – imports and exports Parquet and CSV (s3, gcs, https, local)
No more data analysis “side-quests” – helps you build intuition about your dataset through automatic profiling
No “run query” button required – responds to each keystroke by re-profiling the resulting dataset
Radically simple interactive dashboards – thoughtful, opinionated, interactive dashboard defaults to help you quickly derive insights from your data
Dashboards as code – each step from data to dashboard has versioning, Git sharing, and easy project rehydration


