Feedback
Visualize data in CrateDB
Dashboard and other data visualization applications and toolkits for visualizing data stored inside CrateDB.
Apache Superset / Preset
![]()
Apache Superset is an open-source modern data exploration and visualization platform, written in Python.
Preset offers a managed, elevated, and enterprise-grade SaaS for open-source Apache Superset.
See also
Managed Superset
Preset Cloud is a fully-managed, open-source BI for the modern data stack, based on Apache Superset.
Hassle-free setup: There is no need to install or maintain software with Preset. Get the latest version of Superset in a secure, reliable, and scalable SaaS experience.
Up-to-date Superset, always: Access all the latest features of Superset released and thoroughly tested every two weeks.
One-click to deploy multiple workspaces: Give each team in your organization a separate Superset workspace to protect sensitive data.
Control user roles and access: Easily assign roles and fine-tune data access using RBAC and row-level security (RLS).
Cluvio
Cluvio is a programmable and interactive dashboarding platform — your analytics cockpit. Run queries, filter your results, choose the most vivid way to display them, and share them with your colleagues and partners without efforts.
Cluvio dashboards are interactive, so you can easily change aggregation, select a specific timerange or filter dashboards by any individual attribute of your data.
Use SQL and R to analyze your data and create beautiful, interactive dashboards for your entire company in few minutes.
Dash
Dash is a low-code framework for rapidly building data apps in Python, based on Plotly. Built on top of Plotly.js, React and Flask, Dash ties modern UI elements like dropdowns, sliders, and graphs, directly to your analytical Python code.
Dash is a trusted Python framework for building ML & data science web apps. Many specialized open-source Dash libraries exist that are tailored for building domain-specific Dash components and applications.
Dash Enterprise
Dash Enterprise is Plotly’s paid product for building, testing, deploying, managing, and scaling Dash applications organization-wide, advertised as the Premier Data App Platform for Python.
When building Dash apps in a business setting, Dash Enterprise supports you to deploy and scale them, plus integrate them with IT infrastructure such as authentication and VPC services, in order to deliver faster and more impactful business outcomes on AI and data science initiatives.
Dash Enterprise enables the rapid development of production-grade data apps within your business. Python has taken over the world, and traditional BI dashboards no longer cut it in today’s AI and ML driven world. Production-grade, low-code Python data apps are needed to visualize the sophisticated data analytics and data pipelines that run modern businesses.
Explo
![]()
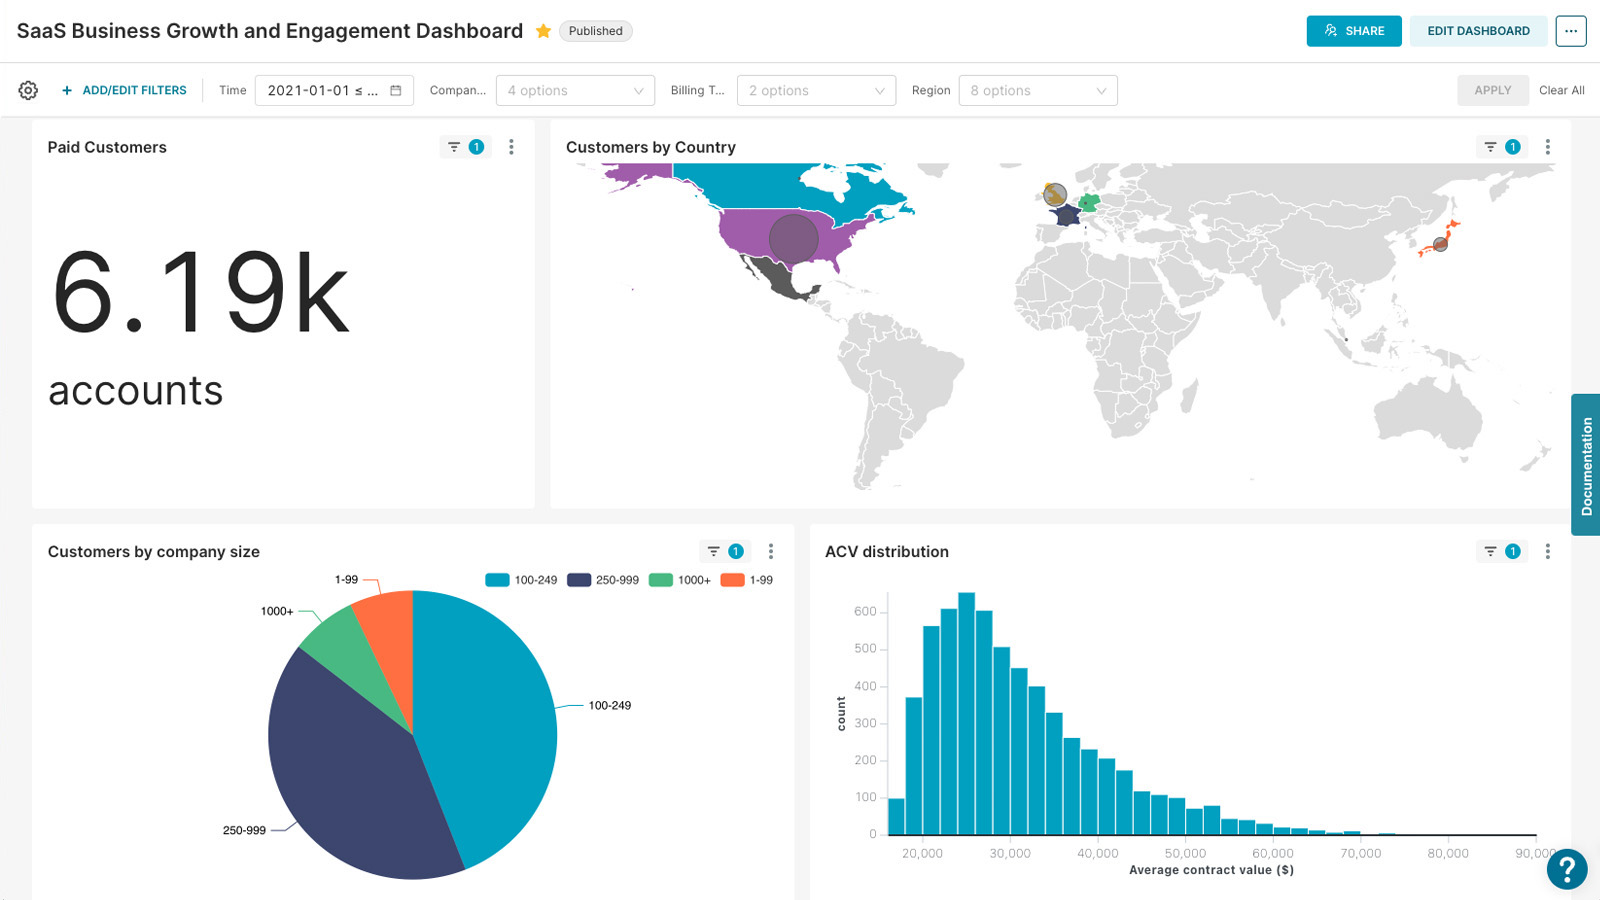
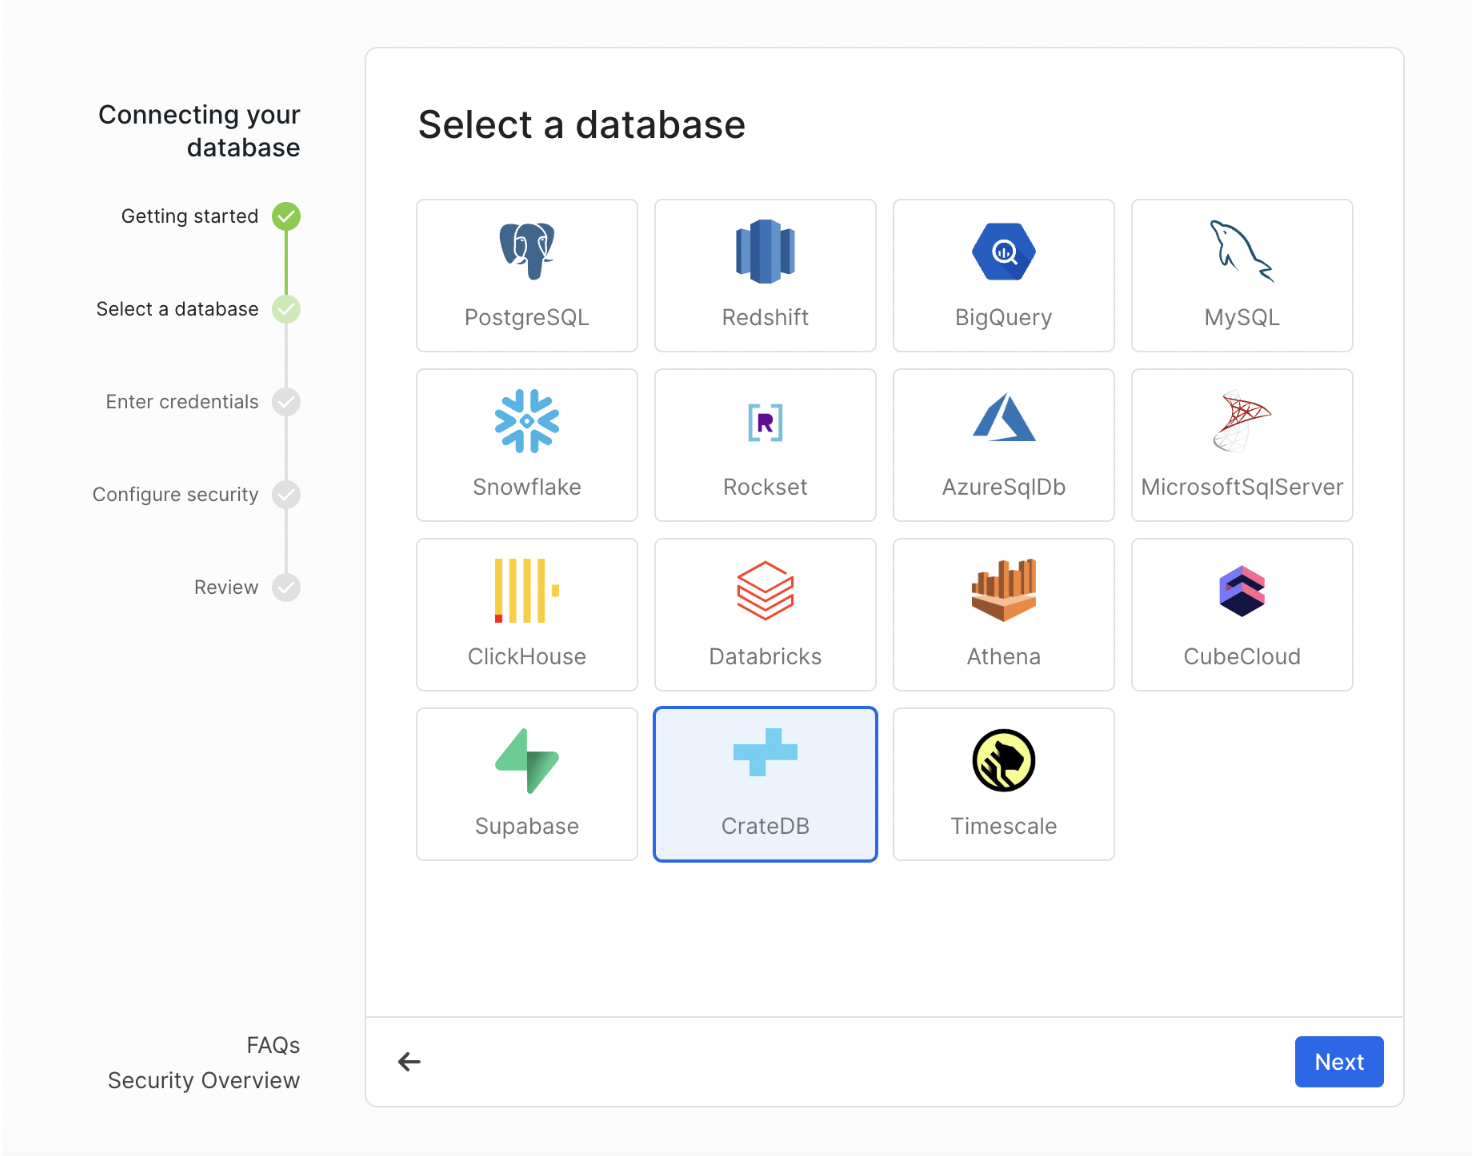
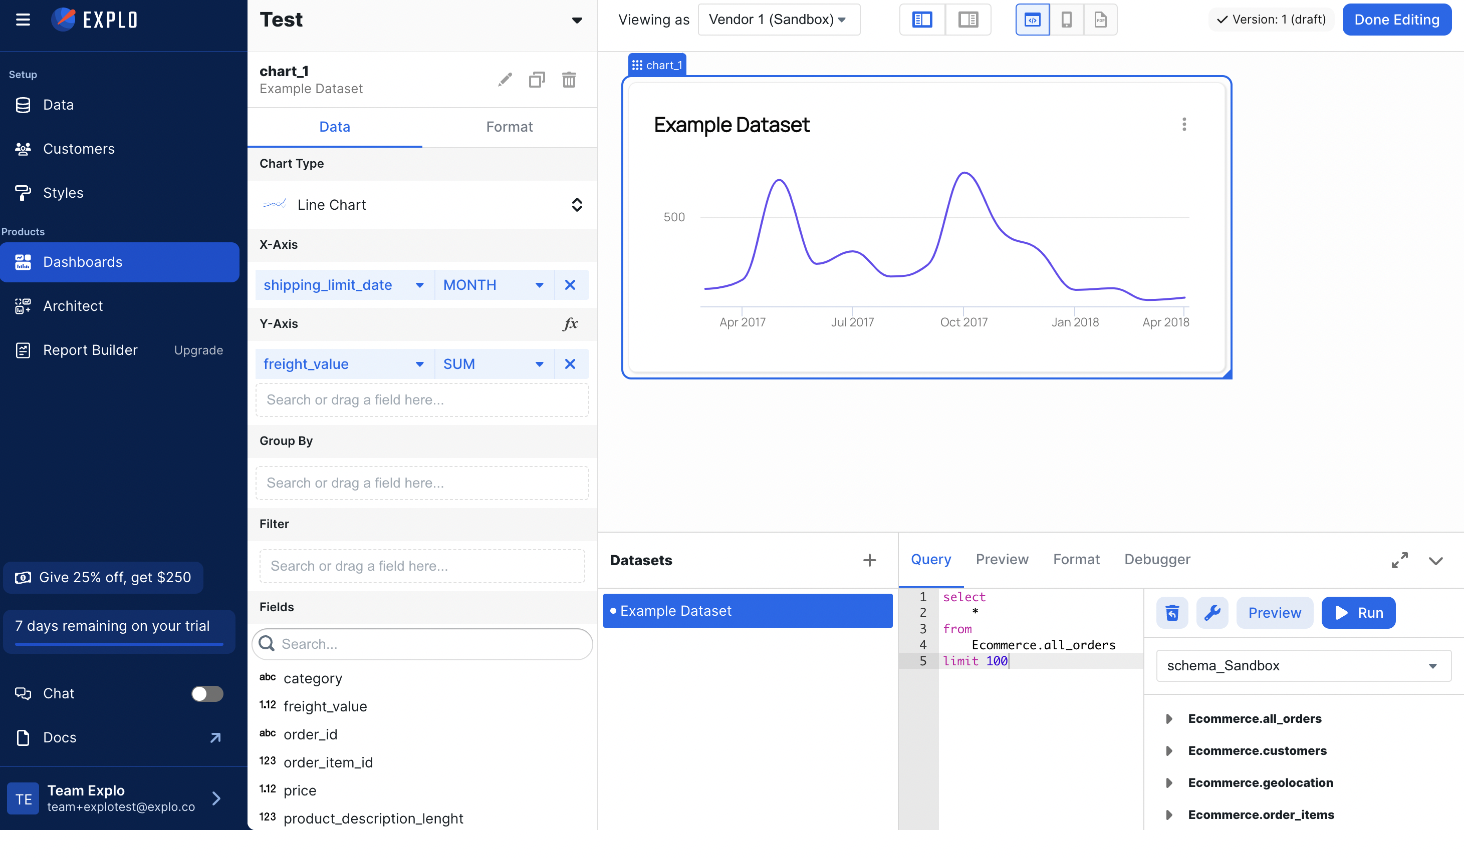
Explo is a software platform for personalized and real-time customer facing analytics. Organizations use Explo’s platform services “Explore”, “Host”, “Report builder”, and “Email”, to activate and share data with their customers.
Explo Explore integrates directly into your web portal or application and provides your customers with a complete self-service data toolkit, which can also be used to run white-labeled data portals.
Grafana
![]()
Grafana OSS is the leading open-source metrics visualization tool that helps you build real-time dashboards, graphs, and many other sorts of data visualizations. Grafana Cloud is a fully-managed service offered by Grafana Labs.
Grafana complements CrateDB in monitoring and visualizing large volumes of machine data in real-time.
Connecting to a CrateDB cluster will use the Grafana PostgreSQL data source adapter. The following tutorials outline how to configure Grafana to connect to CrateDB, and how to run a database query.


See also
Managed Grafana
![]()
Get Grafana fully managed with Grafana Cloud.
Offered as a fully managed service, Grafana Cloud is the fastest way to adopt Grafana and includes a scalable, managed backend for metrics, logs, and traces.
Managed and administered by Grafana Labs with free and paid options for individuals, teams, and large enterprises.
Includes a robust free tier with access to 10k metrics, 50GB logs, 50GB traces, 50GB profiles, and 500VUh of k6 testing for 3 users.
hvPlot and Datashader
![]()
![]()
hvPlot is a familiar and high-level API for data exploration and visualization. Datashader is a graphics pipeline system for creating meaningful representations of large datasets quickly and flexibly.
It is used on behalf of the hvPlot package, which is based on HoloViews, from the family of HoloViz packages of the PyViz ecosystem.
With Datashader, you can “just plot” large datasets and explore them instantly, with no parameter tweaking, magic numbers, subsampling, or approximation, up to the resolution of the display.
hvPlot sources its power in the HoloViz ecosystem. With HoloViews, you get the ability to easily layout and overlay plots, with Panel, you can get more interactive control of your plots with widgets, with DataShader, you can visualize and interactively explore very large data, and with GeoViews, you can create geographic plots.
Metabase
![]()
Metabase is the ultimate data analysis and visualization tool that unlocks the full potential of your data. Build for data and made for everyone, Metabase can be leveraged with no SQL required.
Fast analytics with the friendly UX and integrated tooling to let your company explore data on their own.


See also
Managed Metabase
![]()
With Metabase Cloud, you will get a fast, reliable, and secure deployment with none of the work or hidden costs that come with self-hosting.
Save the time needed for setup and maintenance of the platform, focusing only on the insights we can get from our data.
Trustworthy, production-grade deployment by people who do this stuff for a living. With the infrastructure, specialists, and thousands of Metabases in our cloud, we’ve put a lot of thought and resources into optimizing hosting.
Upgrades: Automatically upgrade to the current version, so you’re always getting the latest and greatest of Metabase.
Backups: The way they should be: there when you need them, out of sight and out of mind when you don’t.
SMTP server: Even your alerts and dashboard subscriptions covered with a preconfigured and managed SMTP server.
Plotly
Plotly Open Source Graphing Libraries make interactive, publication-quality graphs. Line plots, scatter plots, area charts, bar charts, error bars, box plots, histograms, heatmaps, subplots, multiple-axes, polar charts, bubble charts, and maps.
The supported programming languages / libraries / frameworks are Python, R, Julia, JavaScript, ggplot2, F#, MATLAB®, and Dash.
Based on Plotly, Dash is a low-code framework for rapidly building data apps in Python.