Feedback
Monitor CrateDB Cloud on Kubernetes
This tutorial introduces a way to set up monitoring of your CrateDB Cloud on Kubernetes cluster. The visualization tool Grafana is used together with Prometheus and Loki to monitor the cluster performance and browse logs, respectively.
Prerequisites
The CrateDB Cloud on Kubernetes installation script requires Helm 3 to be present in the system.
For a deployment with Grafana, Loki, and Prometheus, we recommend at least 5 CPUs and 5 GiB of memory per CrateDB node for acceptable performance.
Cluster Deployment
The first step is to sign up in the Cloud Console if you haven’t done so yet. After that, you can deploy your cluster.
Deployment steps will depend on your
cloud provider, or on
your local environment, if you choose the
self-hosted variant of CrateDB
Cloud on Kubernetes.
Install Grafana and Loki
The first important step comes after the successful installation of CrateDB into your chosen system. Right after you get the following console prompt:
✓ Region is connected to CrateDB Cloud.
✓ Successfully validated installation
This means that base installation is done. You will now be asked if you
want to have Grafana installed in the system. Press Y to opt-in:
Optional installation of Loki and Grafana
-----------------------
! Loki and Grafana not detected.

=============================================================================
CrateDB Edge encourages the usage of Loki and Grafana to ease support.
Would you like to install Loki and Grafana?

=============================================================================
Install? [Yy] y
After successful installation, you will get the following output:
✓ Installed.
Loki and Grafana successfully installed.
Note
If you already have a CrateDB Edge cluster deployed and didn’t choose to install Grafana and Loki initially, you can rerun the install script to get them when needed.
Accessing Grafana UI
You will notice that during the installation of Grafana, you are provided with a number of useful commands that will help you access the Grafana UI once its installation is finished.
Grafana user password
As a part of the installation process, a user account is created for
Grafana. The username is admin and the password can be retrieved with
the following command:
kubectl get secret --namespace crate-loki crate-grafana -o jsonpath="{.data.admin-password}" | base64 --decode ; echo
You will get a response with a password:
rpz654Q2k8D5vgcvvrRgQMZAC2gKxZJH4oQf09fB
Port-forwarding to get the Grafana URL
To get the URL of your Grafana UI, you need to issue the following commands:
export POD_NAME=$(kubectl get pods --namespace crate-loki -l "app.kubernetes.io/name=grafana,app.kubernetes.io/instance=crate-grafana" -o jsonpath="{.items[0].metadata.name}")

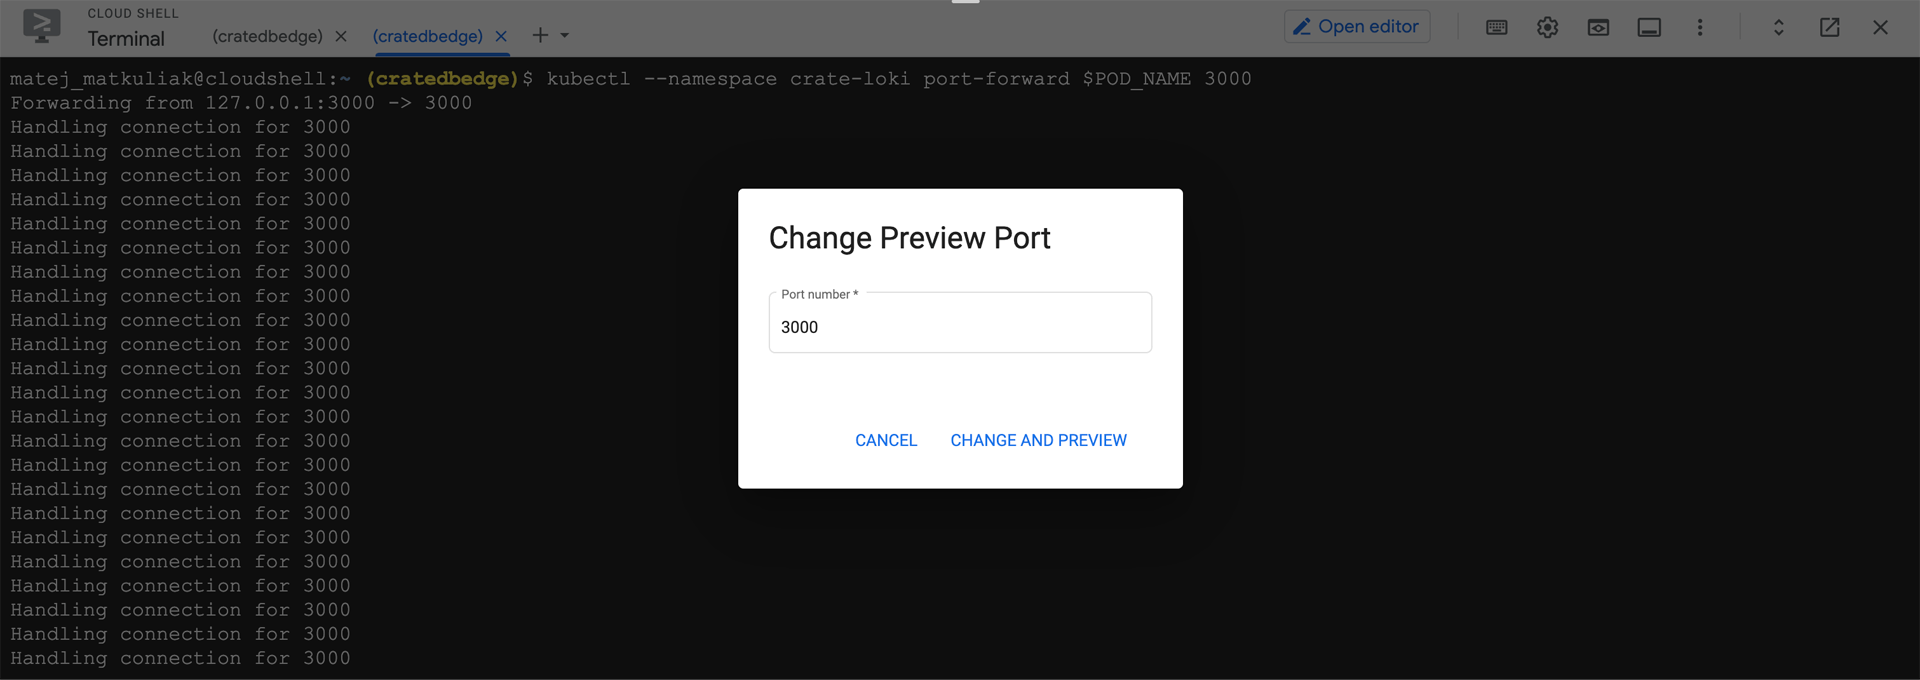
kubectl --namespace crate-loki port-forward $POD_NAME 3000
This will forward your running Grafana instance to port 3000. You can
then view it on that port. For this tutorial, we used Google Cloud
Engine. After issuing the command, we use the “Web preview” to see
Grafana UI on port 3000.
Note
Depending on your environment, it is possible that port 3000 will already be occupied. If that’s the case, you will see following response:
Unable to listen on port 3000: Listeners failed to create with the following errors:
[unable to create listener: Error listen tcp4 127.0.0.1:3000: bind: address already in use unable to create listener:
Error listen tcp6 [::1]:3000: bind: cannot assign requested address]
error: unable to listen on any of the requested ports: [{3000 3000}
When that happens, reissue the port-forwarding command with a different port. E.g.
kubectl --namespace crate-loki port-forward $POD_NAME 3001
Adding the Prometheus data source
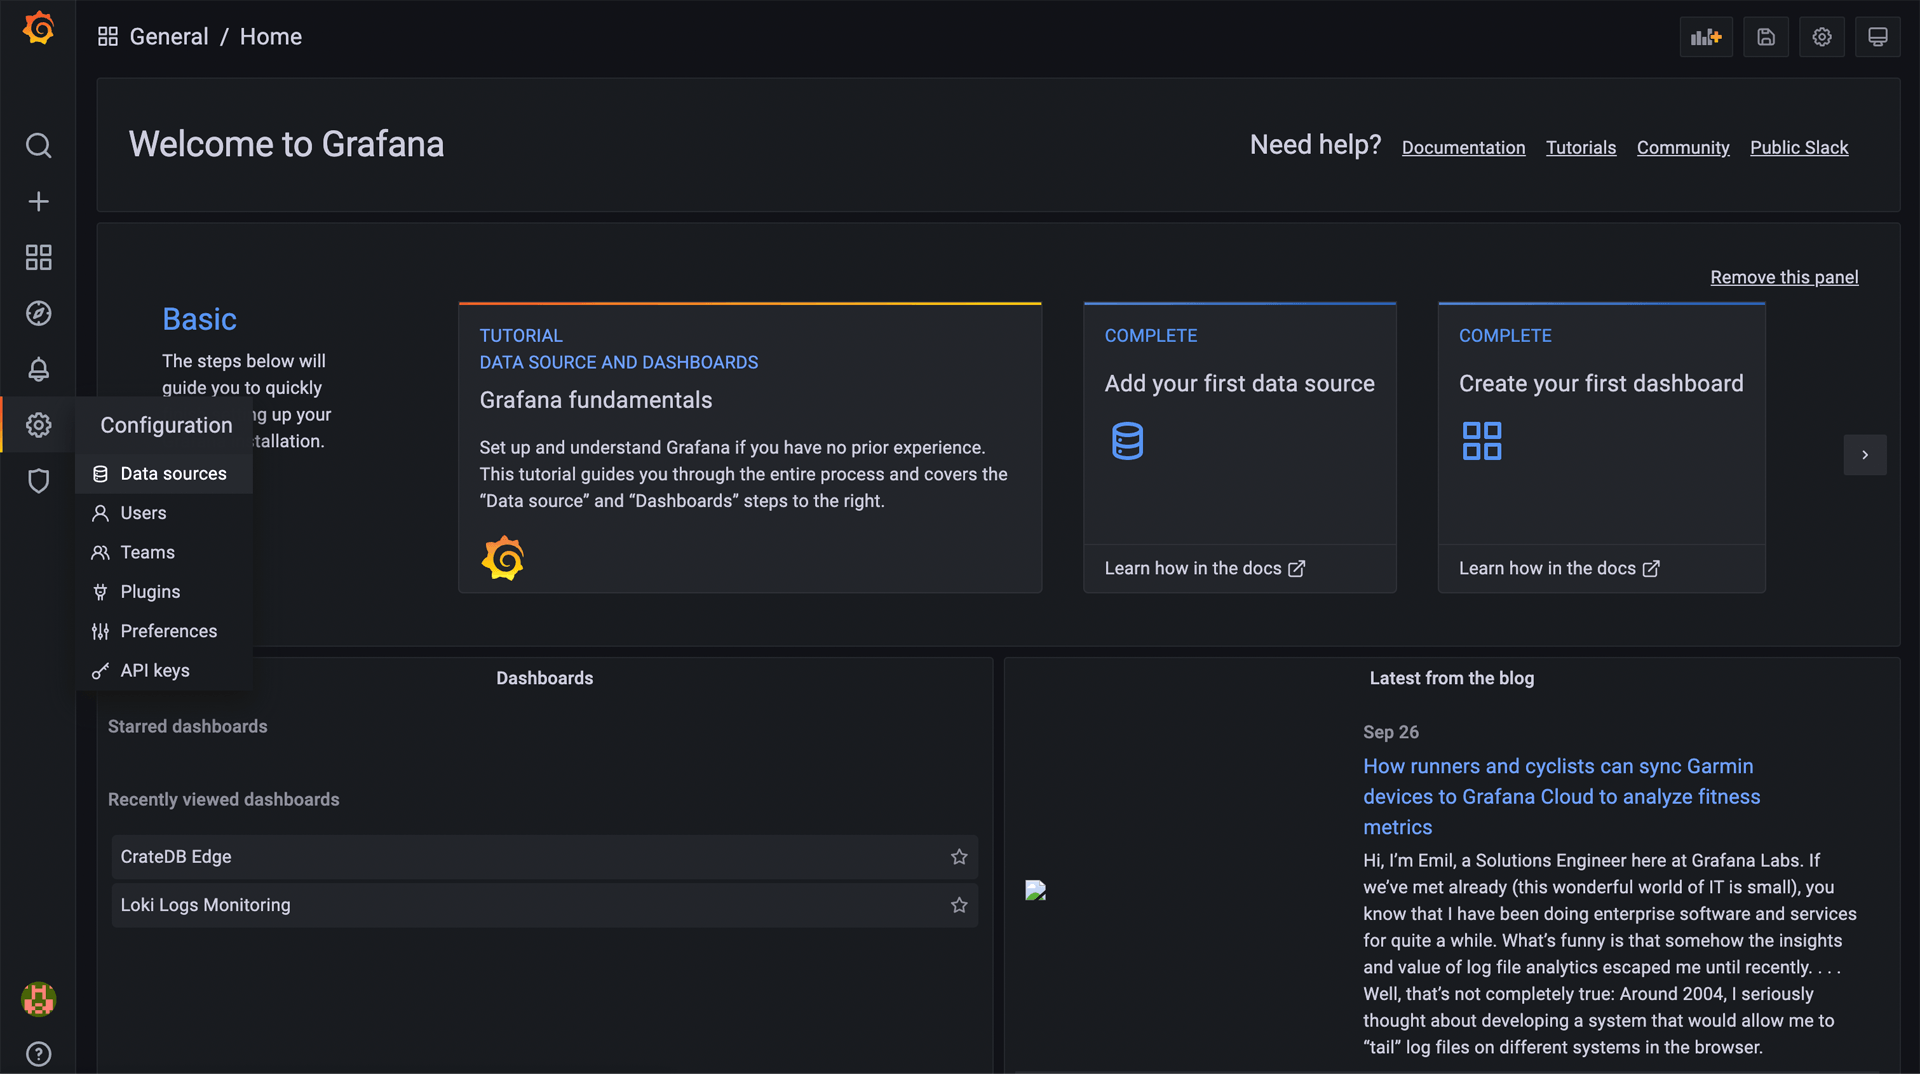
At this point, you should be able to access the Grafana UI. After
logging in, it is necessary to add Prometheus as a data source, by
navigating to the Configuration -> Data sources in the left-hand menu:
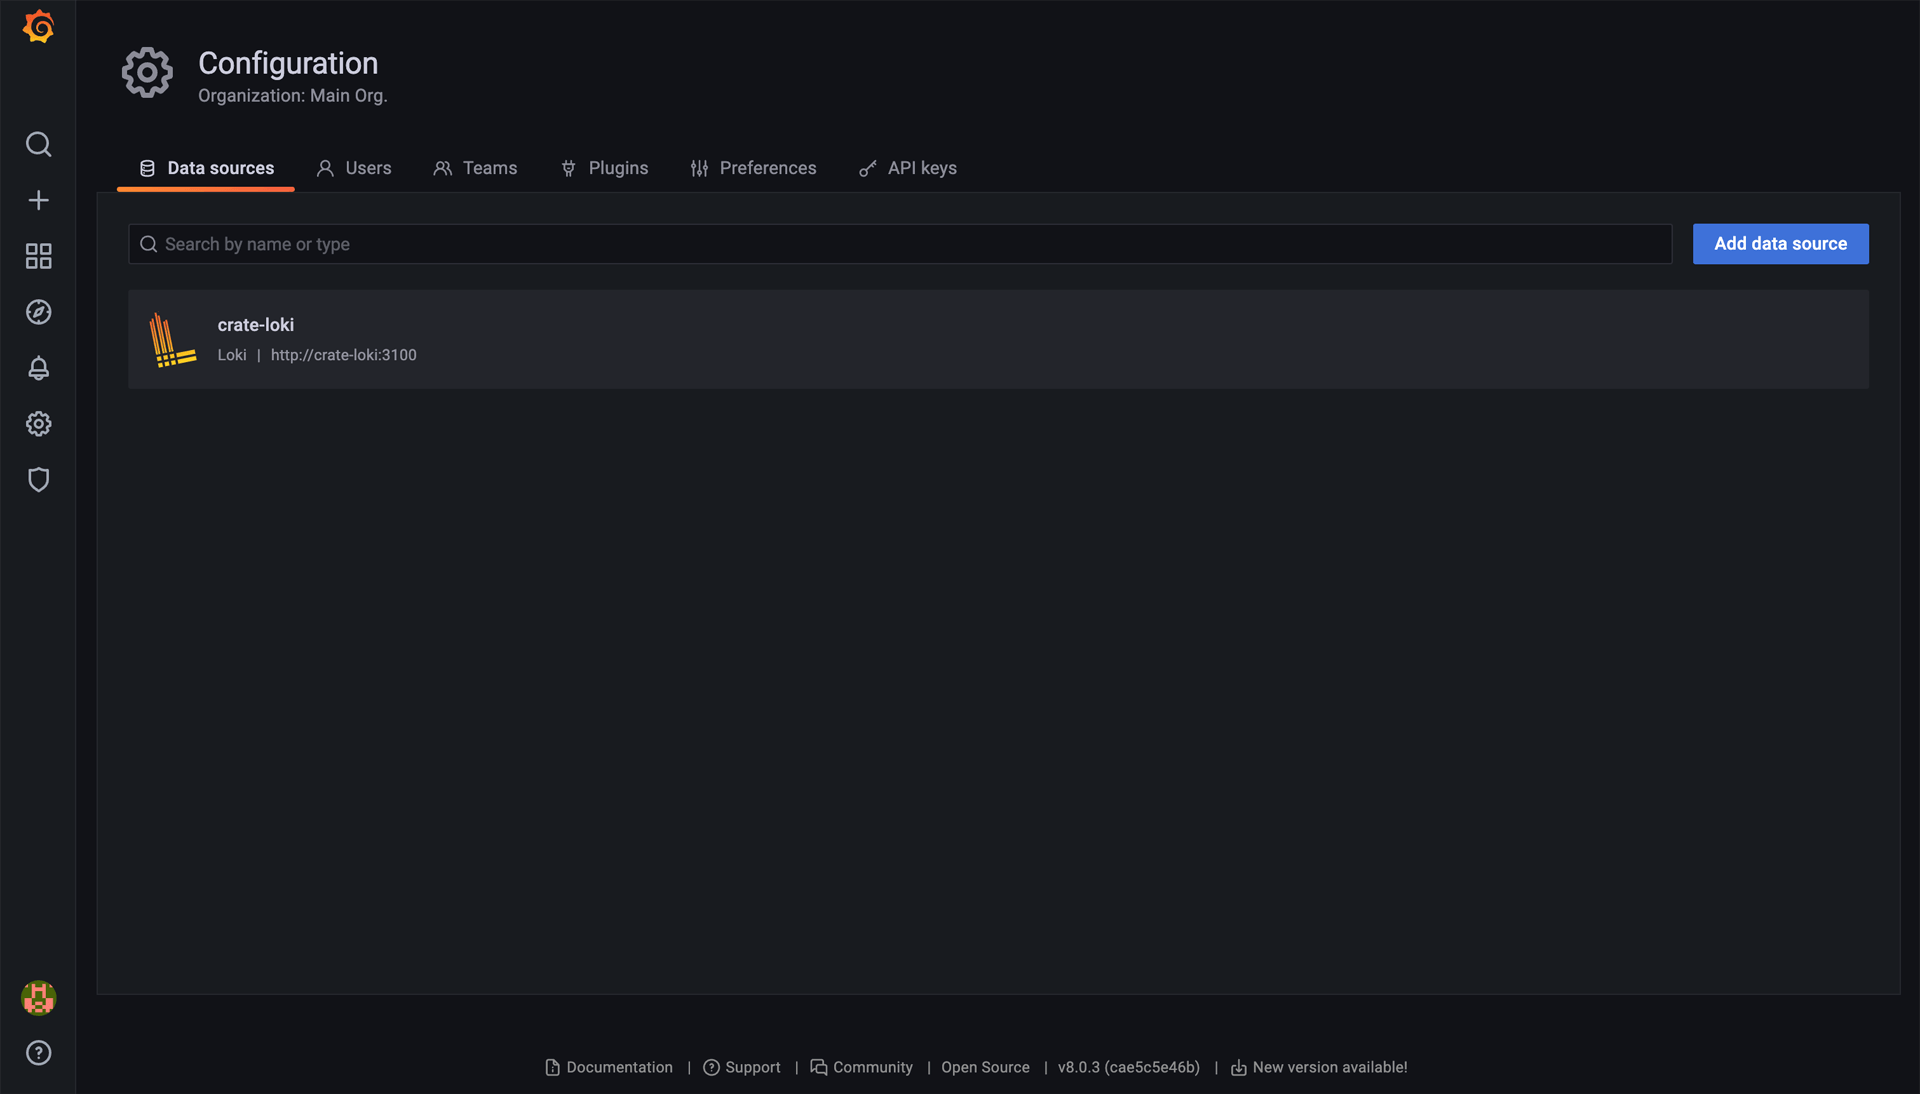
You will see that out-of-the-box, the data source for Loki, is already present.
To monitor cluster performance, you need to add another data source -Prometheus. Click the “Add data source” button in the top right to add a new data source. Choose “Prometheus” when shown the list of options. You will be brought to the data source configuration page.
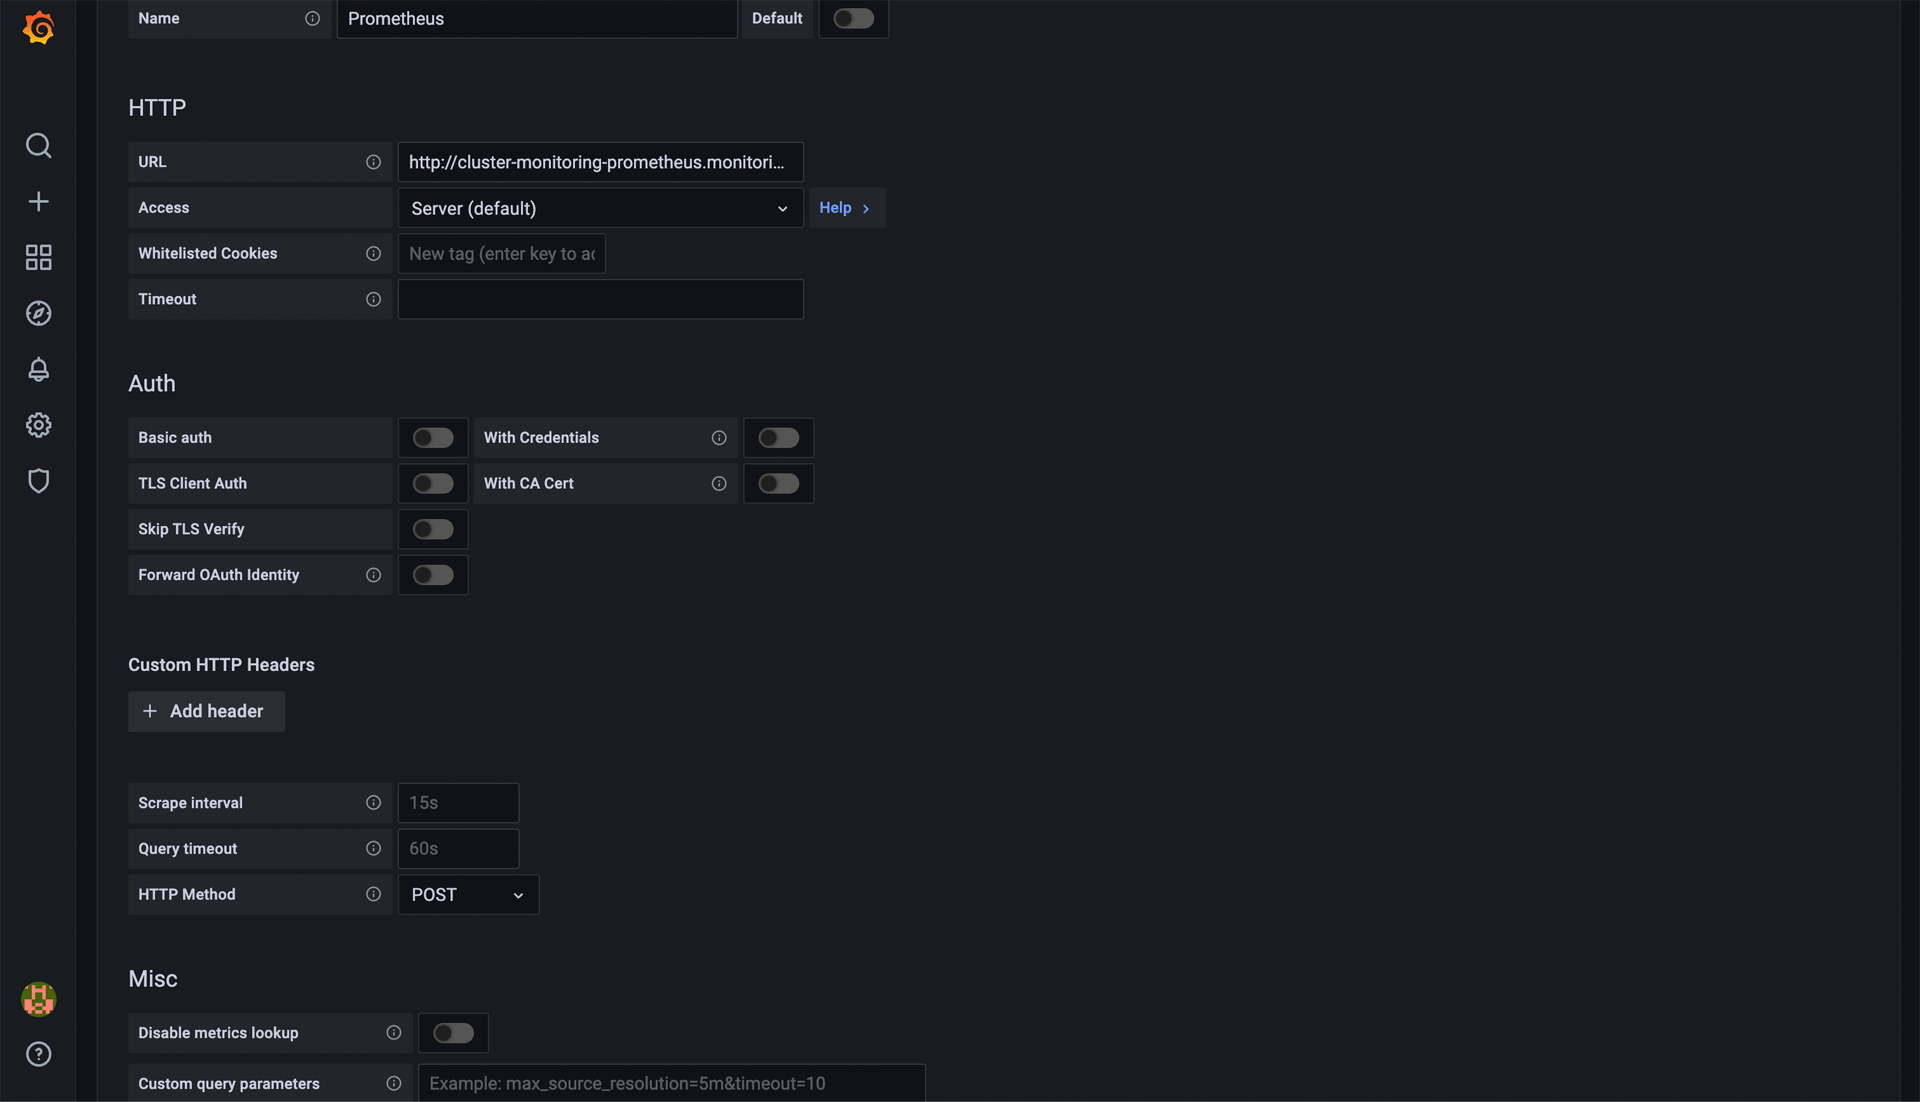
The only field that you need to fill out is “URL”. The URL for Prometheus is always:
http://cluster-monitoring-prometheus.monitoring.svc.cluster.local:9090
After that, click “Save & test” at the bottom of the page. You should get a response “Data source is working”
Importing the dashboards
Now that you have the necessary data sources, you can import the example
dashboards. Select Dashboards -> Manage in the menu on the left. Then,
select “Import” in the top right.
Both of these .json files need to be imported:
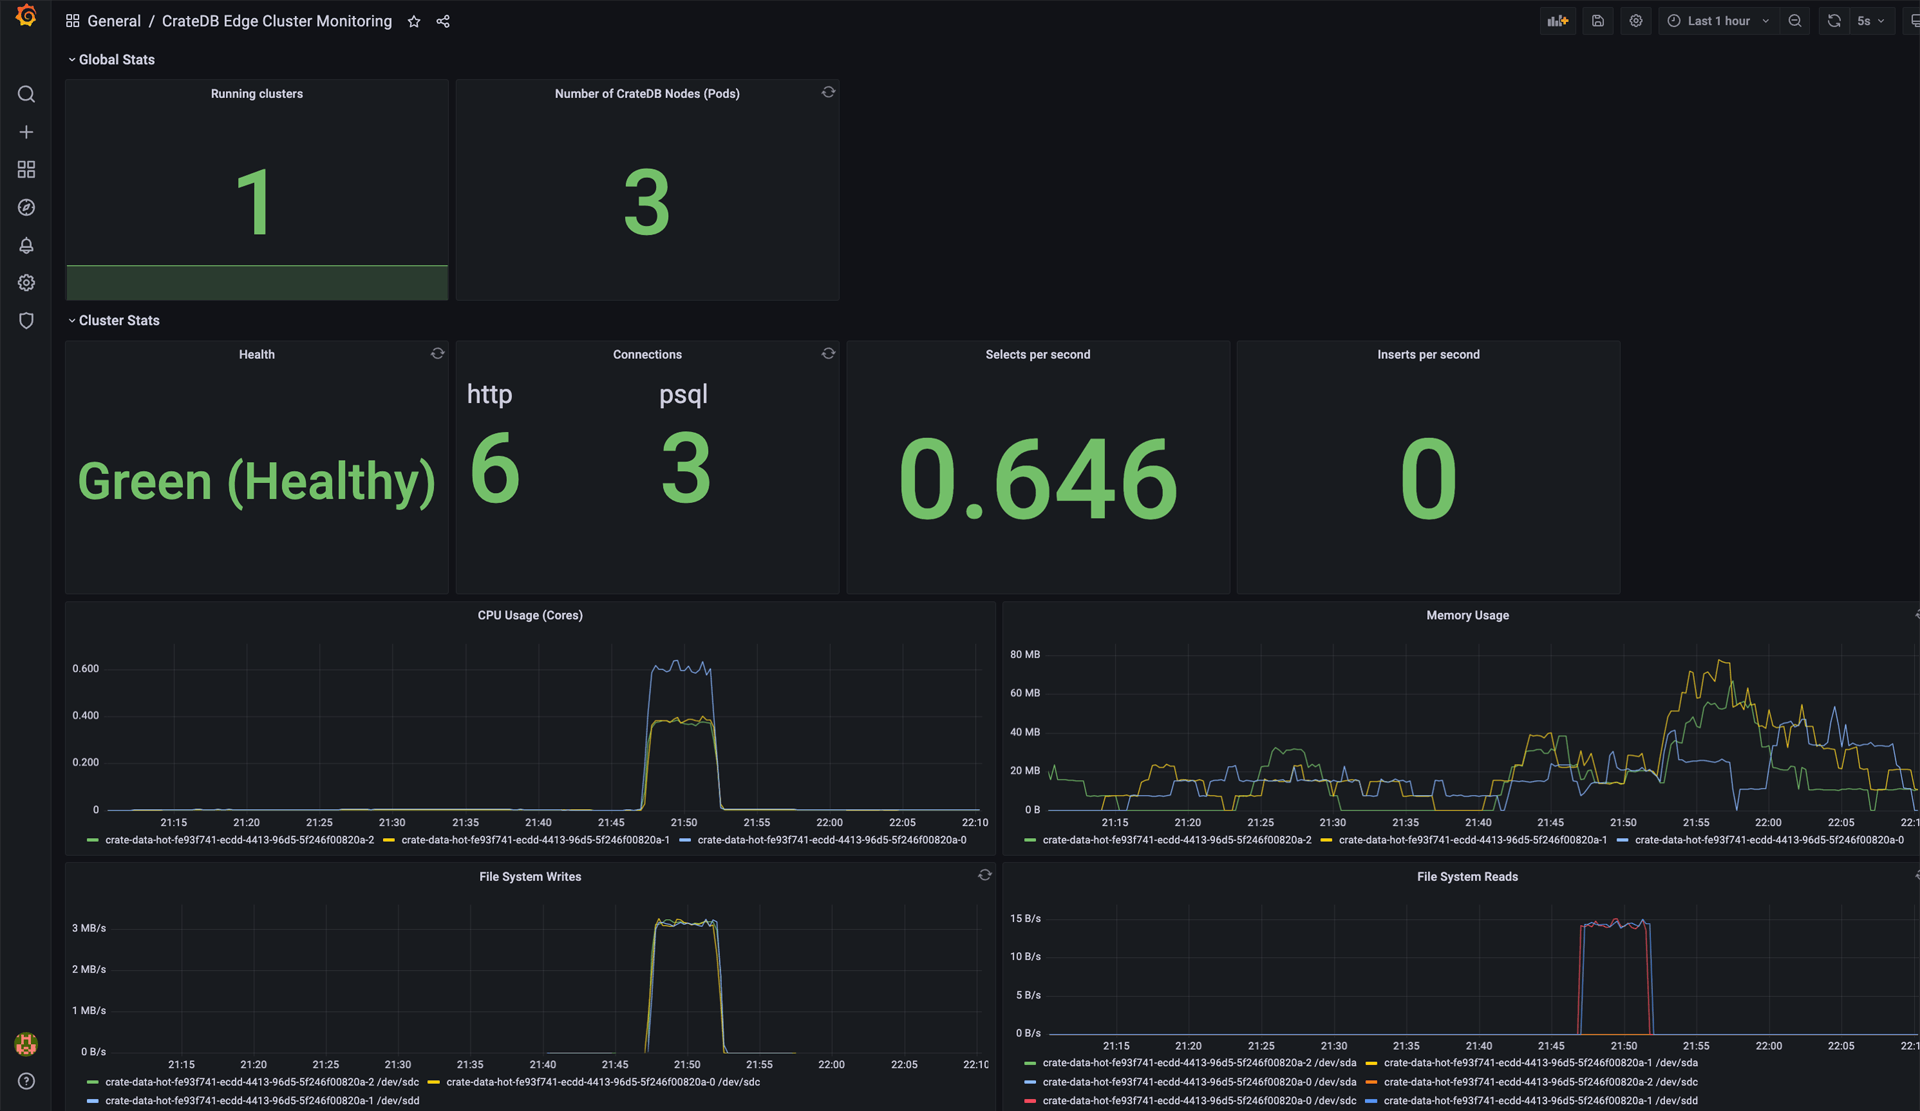
Cluster monitoring dashboard
This dashboard utilizes metrics provided by Prometheus. It monitors the following metrics:
Number of running clusters
Number of running nodes
Cluster health
Number and types of opened cluster connections
Selects & Inserts per second
CPU usage
Memory usage
File system writes & reads
Logs monitoring dashboard
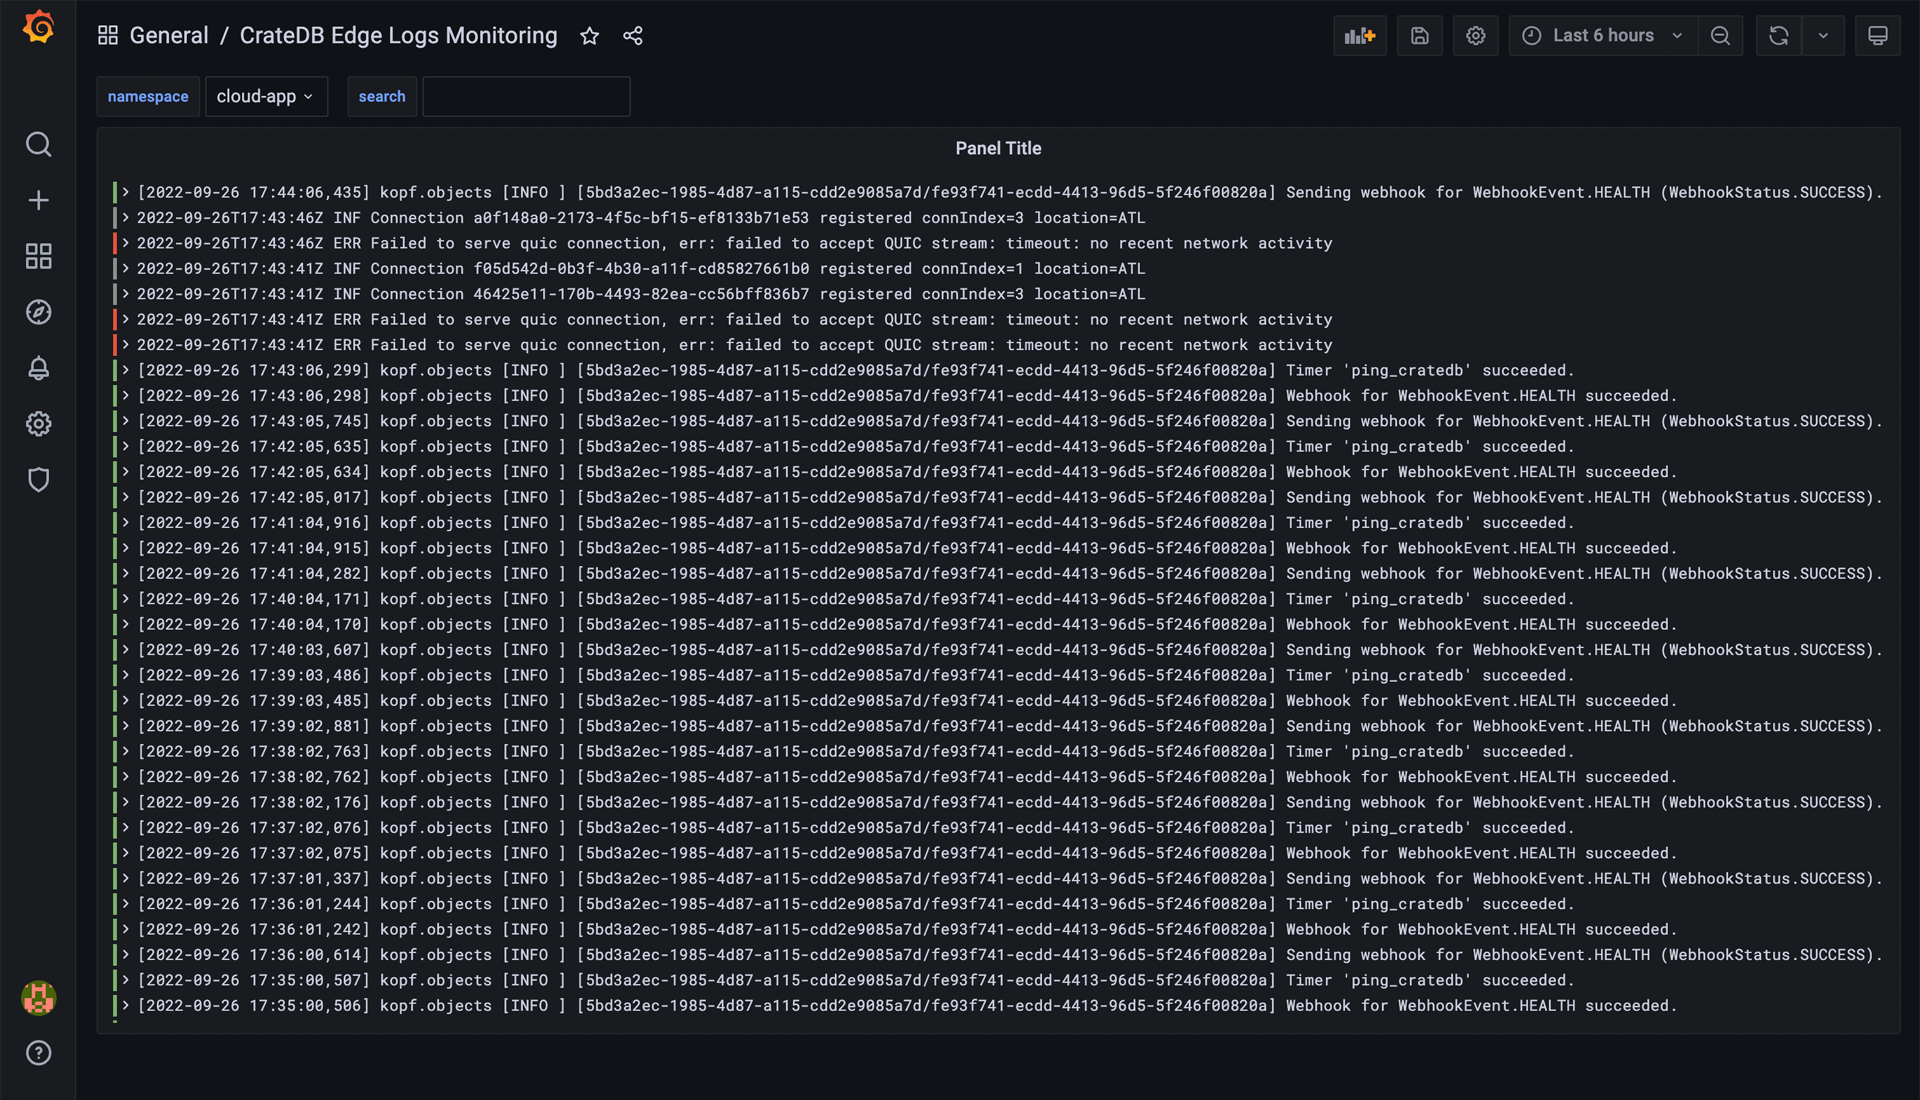
This dashboard uses Loki to store the logs from available namespaces, with ability to search for strings in the logs.
Conclusion
This tutorial should serve as an introduction to CrateDB Cloud on Kubernetes monitoring using Loki & Prometheus in Grafana. When you complete it, you should have two handy introductory dashboards to monitor your cluster’s performance and operations.
Of course, the best dashboards for you will vary based on your use case and needs. Because of that, we encourage you to play around with these provided dashboards and also visit documentation for Loki and Prometheus in Grafana which will help you to build dashboards best suited for your needs.
If this looks interesting to you, go to Cloud Console and give it a try!