In this post, we would like to explore CrateDB’s writing performance through a series of batched insert benchmarks.
We don’t discuss performance very often because we see a couple of issues in the benchmarking space:
- Overall lack of transparency
- Reproducibility issues
- Use case issues
To eliminate all of these issues, we would like to start a series where we transparently explore our own performance limits and disclose all the used tools and infrastructure.
Let's start with writing performance. It is one of CrateDB's biggest strengths when utilized correctly. We will demonstrate this through a series of batched insert benchmarks performed on different tiers of CrateDB Cloud clusters.
We applied many learnings from our previous benchmarking adventure: Scaling ingestion to one million rows per second. If you haven't read it yet, we encourage you to do so!
Contents:
What we want to achieve
We like to be transparent with our customers and users about the performance they can expect from our product. We want to introduce a reliable and verifiable way of measuring performance with a workload that suits CrateDB. We also want to make clear that this is only one use case and one type of workload.
If you want to see how we can handle a different use case or workload, don’t hesitate to contact and challenge us!
Additional steps we took to get as close as possible to the real-world use case:
- The data generated by the benchmarking tool must be representative, including numerical and textual columns in a non-trivial structure.
- All the components of the infrastructure we used are disclosed and easily replicable.
- We measured the performance with an out-of-the-box configuration of CrateDB Cloud clusters.
Infrastructure
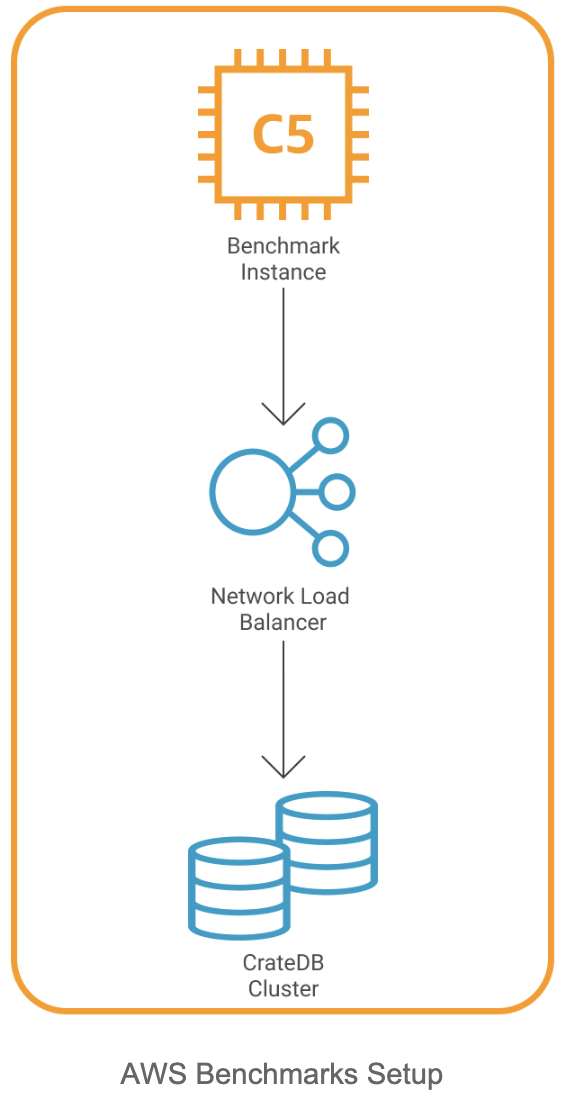
For the ingesting tool/benchmark VM, we decided to go with the c5.12xlarge EC2 instance. We don’t need all the 48 CPUs this instance offers, but it’s the most affordable instance with 12 Gigabit networking, which can be necessary when ingesting into higher-tier CrateDB Cloud clusters.
As for the CrateDB Cloud clusters, this benchmark was performed on AWS deployment. We also offer clusters running on Azure. The performance is comparable in both environments. These are the instances that we currently use:
- AWS - m5.4xlarge
- Azure - D16s v5

CrateDB Clusters
For the CrateDB Clusters we used our Cloud platform. It offers fully-managed clusters that can be deployed in a matter of seconds. It comes with 4 tiers of clusters, depending on the workload that you’re expecting:

These are per-node resources. When deploying multi-node clusters, simply multiply these by the number of nodes. Storage is a big part of fast writing. Offered storage depends on the tier of the cluster, but in general, we offer storage of up to 8 TiB of enterprise-level SSD per node.
If you want to follow this step of the setup, deploy your CrateDB Cloud cluster here.
Benchmarking
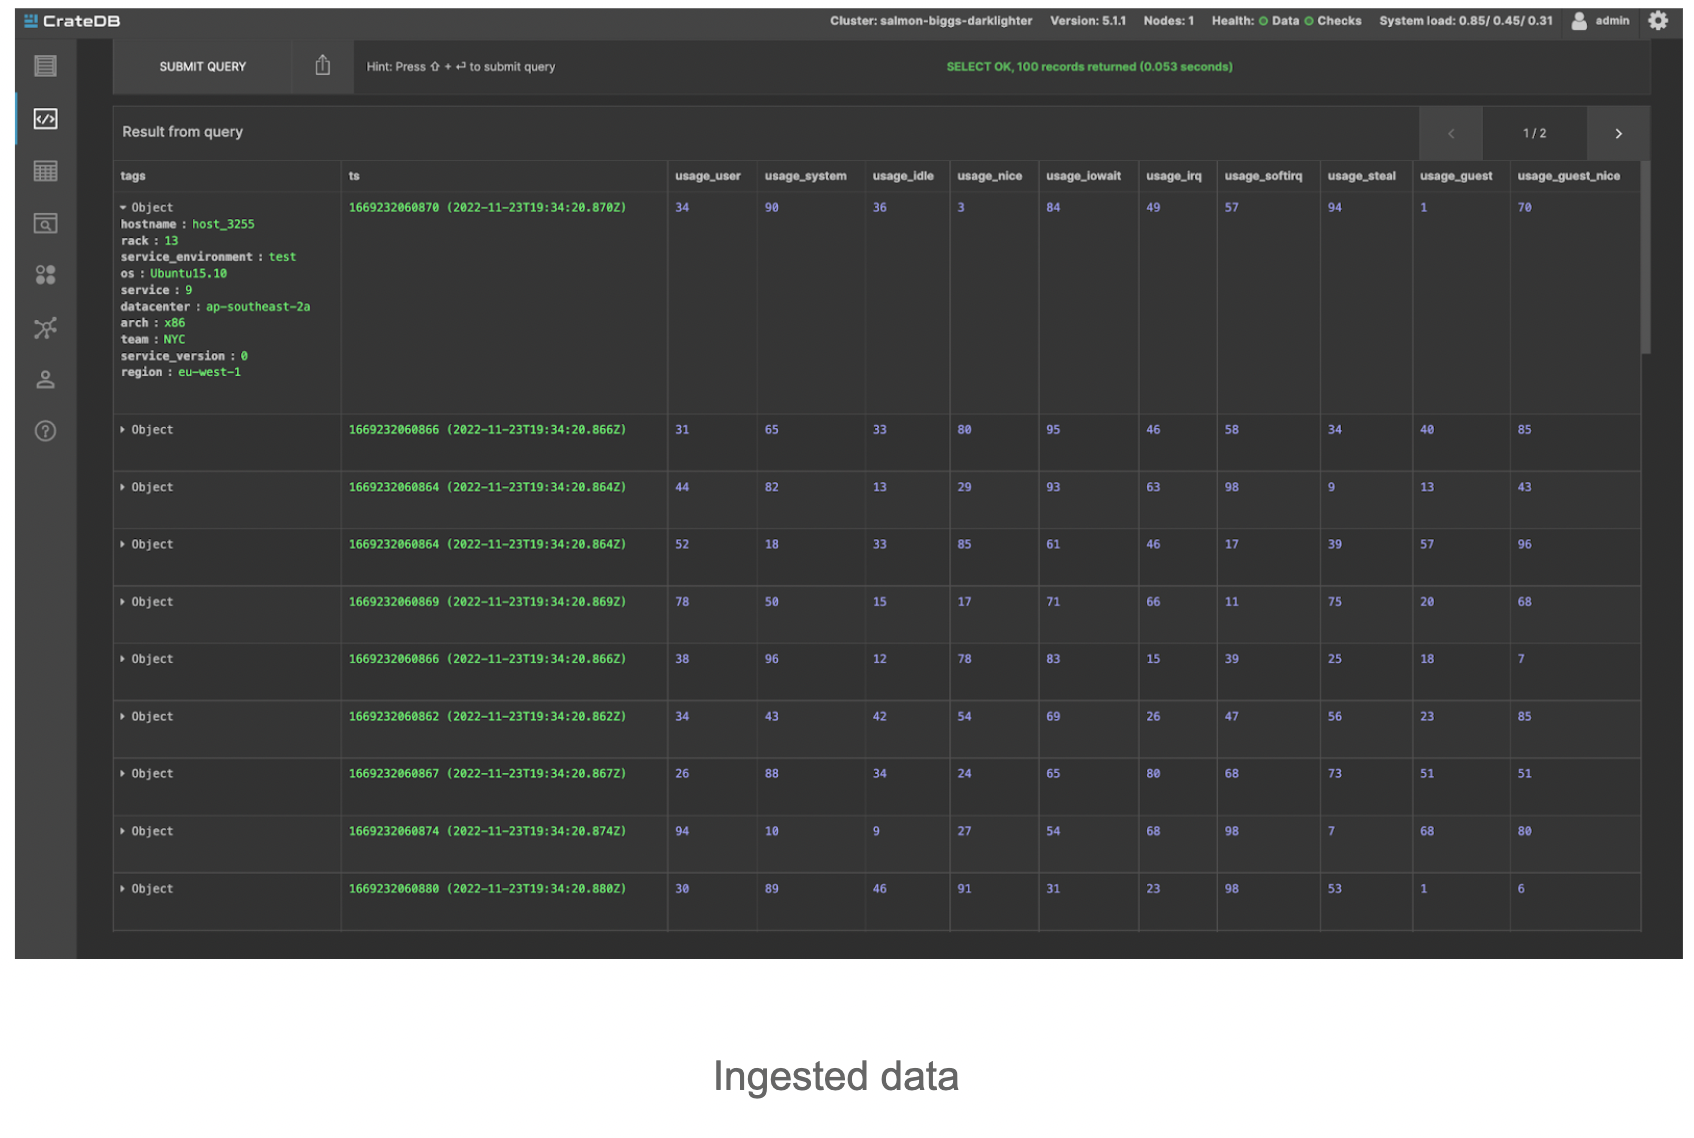
We used the nodeIngestBench for all the benchmarking. It is a multi-process Node.js script that runs high-performance ingest benchmarks on CrateDB. It uses a data model that was adapted from Timescale’s Time Series Benchmark Suite (TSBS). One thing that we want to make clear is that nodeIngestBench is a write benchmark. The data structure that it creates is unsuitable for any performance-indicative reading tests because of its high cardinality (due to random data) and no partitioning.
CREATE TABLE IF NOT EXISTS doc.cpu (
"tags" OBJECT(DYNAMIC) AS (
"arch" TEXT,
"datacenter" TEXT,
"hostname" TEXT,
"os" TEXT,
"rack" TEXT,
"region" TEXT,
"service" TEXT,
"service_environment" TEXT,
"service_version" TEXT,
"team" TEXT
),
"ts" TIMESTAMP WITH TIME ZONE,
"usage_user" INTEGER,
"usage_system" INTEGER,
"usage_idle" INTEGER,
"usage_nice" INTEGER,
"usage_iowait" INTEGER,
"usage_irq" INTEGER,
"usage_softirq" INTEGER,
"usage_steal" INTEGER,
"usage_guest" INTEGER,
"usage_guest_nice" INTEGER
) CLUSTERED INTO <number of shards> SHARDS
WITH (number_of_replicas = <number of replicas>);
It creates a single doc.cpu table where each row is made of 10 randomly generated numerical metrics. The rows get ingested in batched inserts. As mentioned previously, default settings are used, which also means that all columns are indexed automatically. One notable setting is shard replication. It comes at a slight writing performance expense, but we encourage the usage of replication in every use case, and practically all of our customers do use it.

Example of a single benchmark run on a 3-node CR4 cluster:
node appCluster.js \
--batchsize 10000 \
--max_rows 200000000 \
--shards 42 \
--concurrent_requests 10 \
--processes 3 \
--replicas 1
batchsize:The number of rows that are passed in a single INSERT statement. The higher the number, the fewer inserts you need to perform to ingest all of the generated data. At the same time, there comes the point of diminishing returns. We found the best value at around 10 000 rows per INSERT.max_rows:The maximum number of rows that will be generated. This is the parameter that allows to control total runtime of the benchmark.shards:The number of shards the table will be split into. Each shard can be written independently, so we aim for a number that allows for enough concurrency. As a rule of thumb, we create one shard per CPU.concurrent_requests:The number of INSERT statements that each child process will run concurrently as asynchronous operations. For single-node and 3-node clusters, we found the value of ten concurrent requests to be ideal
processes:The main node process will start this number of child processes (workers) that generate INSERT statements in parallel. Generally, we found the best performance with one process per CrateDB node.replicas:Replicas are pretty much pointless on single-node clusters. On multi-node clusters, however, they provide a great way to avoid data loss in case of node failure. For 3-node cluster we created one replica.
As for the single-node benchmarks, this is an example configuration for a CR4 single-node cluster:
node appCluster.js \
--batchsize 10000 \
--max_rows 20000000 \
--shards 14 \
--concurrent_requests 10 \
--processes 1
Results
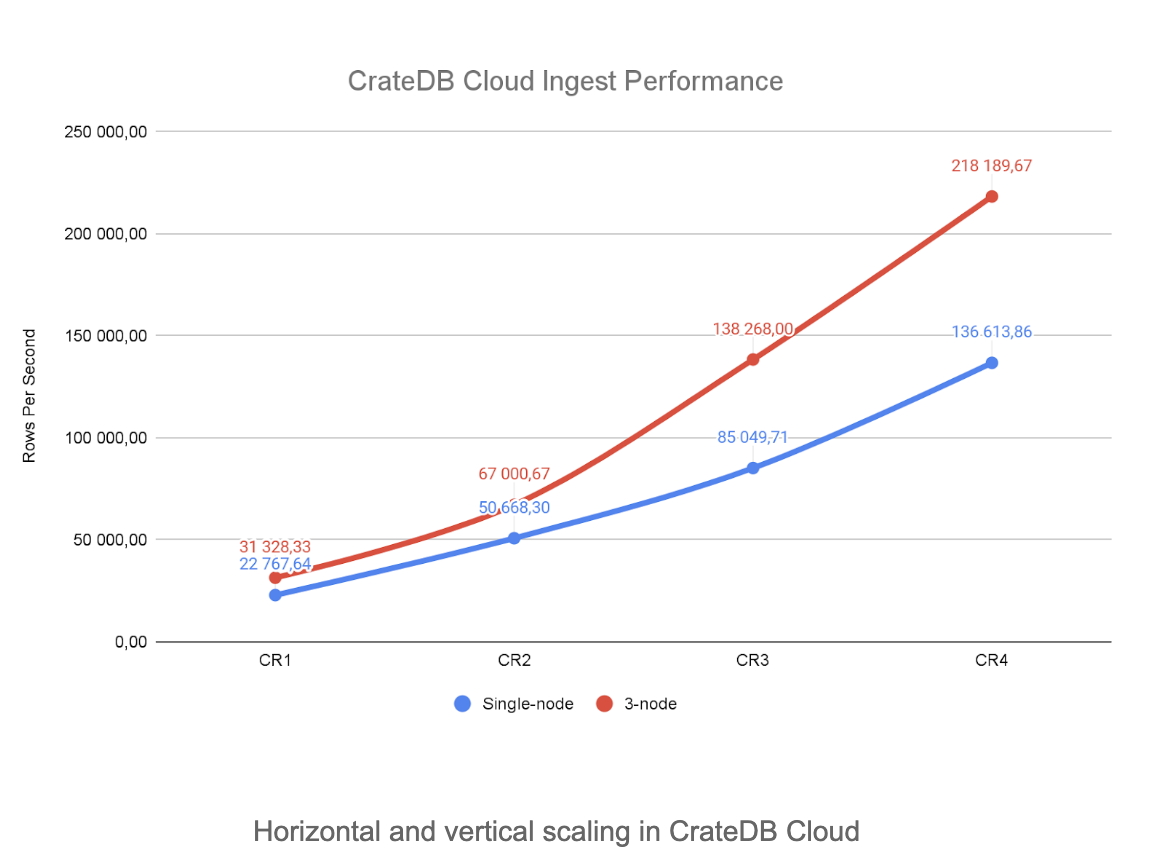
We ran the benchmark on both single-node and 3-node clusters to see how they compare.

The first thing we noticed is that lower-tier 3-node clusters (CR1 and CR2) offer a smaller improvement over their single-node counterpart than CR3 and CR4. This is because of the increased intra-cluster network traffic and overhead created by enabled replicas.

Here we have a comparison of the performance gained by scaling from one node to three nodes. You can see that performance gain varies from around 30% in smaller clusters to around 60% in higher clusters. However, as mentioned before, performance isn’t the only thing you gain by scaling your cluster to multi-node. Data loss prevention and high availability are big topics for many customers, and multi-node is the only way to get that.
That being said, we also want to enable our customers to do whatever they want with their clusters. If you’re purely after performance and are willing to sacrifice some protective measures because of it, one step you can take is disabling replicas in multi-node clusters. We don’t encourage users to do this, and haven’t encountered a production grade setup where this was necessary, but you’re free to do so.
Disabling replicas improved the ingest performance by 50% on average. Keep in mind that without replicas there is a possibility of data loss upon a non-recoverable node failure. As the data is split evenly among the nodes, the data loss would be around 1/X, X being the number of nodes in a cluster.
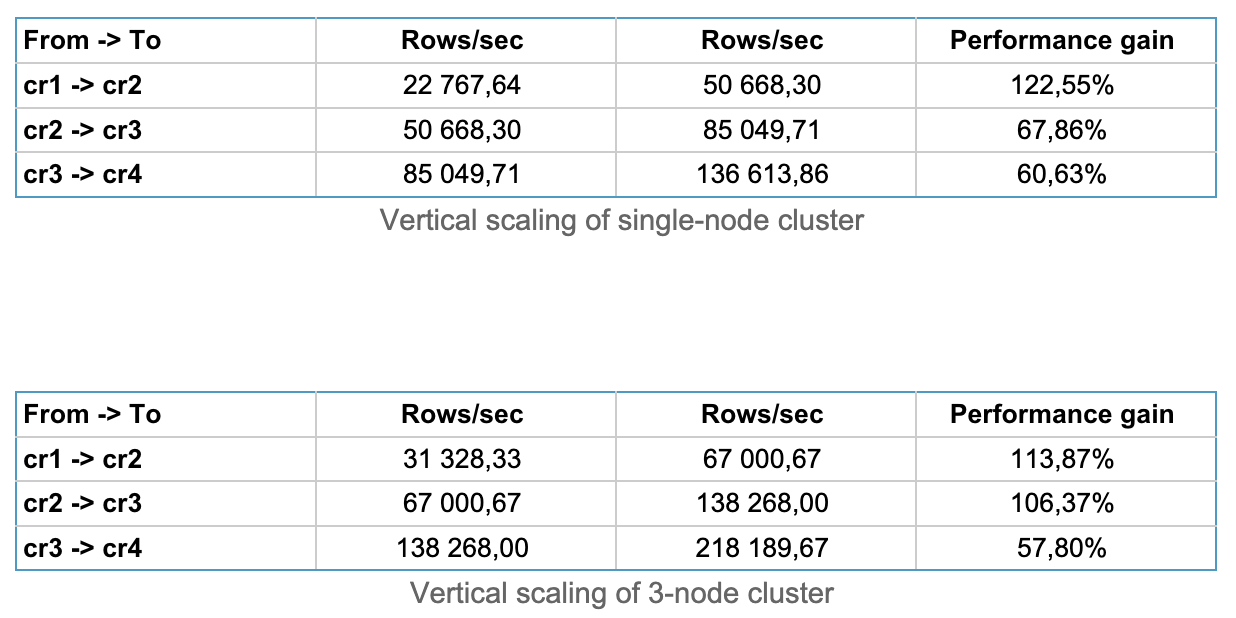
Vertical scaling can, of course, also be useful. If you’re already scaled to multi-node and need a bit more performance, or you’re testing your application and are not interested in multi-node benefits, increasing the tier of your cluster can also be helpful. It should, however, be secondary to horizontal scaling. We advise our customers to scale to a higher node count as long as possible.

Vertical scaling from CR1 offers the biggest improvement, as it's a very affordable tier suited for small applications and compatibility testing. In higher tiers, the performance gained by vertical scaling drops. The average improvement provided by vertical scaling is around 90%.
Conclusion
In this post, we hoped to provide users with a relatively simple introduction to benchmarking their CrateDB clusters. In our scenario, we showed what performance can be expected when using the CrateDB Cloud clusters, but this same process can be replicated on on-premise clusters using a diverse range of hardware.
These benchmarks provide only a single-use case using batched inserts, and we hope to follow this post with others in the future. The next logical step would be looking into read performance or maybe the write performance of the before mentioned on-premise hardware.
If you have a specific scenario or use a case in mind that you would like to see, don’t hesitate to reach out.


