Power BI is a business intelligence (BI) software suite that provides self-service data analytics and visualizations. Users can create reports and dashboards for themselves, without having to rely on your IT department.
CrateDB is a distributed SQL database that makes it simple to store and analyze massive amounts of machine data in real-time.
Together, Power BI and CrateDB provide a powerful end-to-end platform for data warehousing and business intelligence.
In this tutorial, I show you how to get started with Power BI Desktop (the desktop version of Power BI) and CrateDB.
Note: Power BI Desktop is a Microsoft Windows application, so you must be using Windows to follow along.
Installation
Power BI
The first thing you need to do is install Power BI Desktop.
Download the Power BI Desktop installer, open the MSI file, and then follow the instructions.
PostgreSQL ODBC Driver
Fortunately, CrateDB supports the PostgreSQL wire protocol. This means that we can use the PostgreSQL ODBC driver with Power BI to connect to and use CrateDB.
Head on over to the PostgreSQL ODBC driver downloads page. Find the latest driver version and pair it with the correct architecture. In my case, I'm using 64-bit Windows, so at the time of writing, the right installer package for me is psqlodbc_11_00_0000-x64.zip.
Once the ZIP file has been downloaded, expand the archive, open the MSI file, and then follow the instructions.
CrateDB
CrateDB requires Java 8 to run. Preferably update 20 or later. If you do not already have Java 8 installed, visit the Java download page and follow the instructions.
Next, we need CrateDB 3.2 or higher.
Head over to the CrateDB downloads page. Select the Release drop-down menu, and make sure that you select version 3.2 or higher. Then select the "Tarball .tar.gz" Package. Finally, choose Download.
At the time of writing, CrateDB 3.2 is a testing release. However, there's a good chance that by the time you're reading this, the stable (i.e., default) version of CrateDB is 3.2 or higher already. In which case, just download that.
Once the tarball is downloaded, you will need to expand it. You can do this with a tool like 7-Zip.
Once installed, start PowerShell, change into the expanded tarball folder, and then start CrateDB, like so:
PS> ./bin/crate
This should output a bunch of messages as CrateDB starts.
If everything went well, the CrateDB Admin UI should be available. Open your browser, and navigate to http://localhost:4200/.
You should see something that looks like this:

Great! You have installed Power BI and CrateDB, and we can continue with the rest of the tutorial.
Get Some Sample Data
The next thing we need to do is get some sample data, so we have something interesting to query and visualize.
For this tutorial, I am using population data that is collected as part of the World Economic Outlook survey. Specifically, I'm interested in population figures, gender breakdowns, and age groups for different countries.
You can download the raw data and process it however you want.
However, to keep this tutorial light, I have pre-processed this data for you into a format that is easy to insert. Preparing data for insertion into a data warehouse is an important topic, but a little out of scope for this introductory tutorial.
Download the pre-processed data archive and expand it.
Before you can insert this data into CrateDB, you will need to create a table that matches the format of the data.
Bring the CrateDB Admin UI back up, and then select the Console icon from the left-hand navigation window. You should see something like this:

Next, copy-and-paste the following CREATE TABLE statement into the console:
CREATE TABLE IF NOT EXISTS "doc"."population_data" (
   "age_category" STRING,
   "age_group" STRING,
   "age_max" DOUBLE,
   "country" STRING,
   "country_id" INTEGER,
   "gender" STRING,
   "population" DOUBLE,
   "region_name" STRING,
   "year" INTEGER
);
Select EXECUTE QUERY. You should see this:

Here we can see that the table was successfully created.
Next, copy-and-paste the following COPY FROM statement into the console:
COPY population_data
FROM 'file:///powerbi/copy_from_data/*.json.gz'
WITH (compression='gzip')
RETURN SUMMARY;
Before executing this statement, you must update the file URI to point to the correct folder on your local machine. In the above example, I saved my pre-processed data to the /powerbi/copy_from_data folder.
For help with file paths, consult the Windows file path documentation.
Select the EXECUTE QUERY button.
CrateDB will take a minute or so to process the data. Once finished, you should see something like this:

CrateDB returns a summary of the insert operations which includes a success_count count. This corresponds to the total number of rows inserted during the execution of the COPY FROM statement.
If you add up the reported insert counts for all four files, you should find that CrateDB has imported around 1,240,000 rows.
You can find the exact figure by executing this query:
SELECT count(*) FROM "doc"."population_data";
Spoiler: 1,240,532 rows.
Configure the ODBC Data Source
Next, we must configure the PostgreSQL ODBC data source.
Open the ODBC Data Source Administrator, following the standard Windows instructions for doing so.
Once opened, you should see a screen like this:

Select Add..., and you should see this:

From this window, select PostgreSQL Unicode. I'm using 64-bit Windows, so "(x64)" is appended. Yours might say "x32".
A Setup window will open.
Set up your data source using the following configuration values:
- Data Source: CrateDB
- Database: doc
- SSL Mode: None
- Server: localhost
- Port: 5432
- Username: crate
Leave Password blank.
When you're done, your screen should look like this:

From here, you can Test the configuration.
If everything was successful, you can select Save and then OK from the confirmation dialogue that pops up.
(If you run into issues, get in touch!)
Connect Power BI and CrateDB
Now that our ODBC data source is configured, we can connect Power BI and CrateDB.
First, open Power BI and create a new document.
Then, select Get Data from the Home ribbon.
You should see something like this:

Select ODBC, and then Connect.
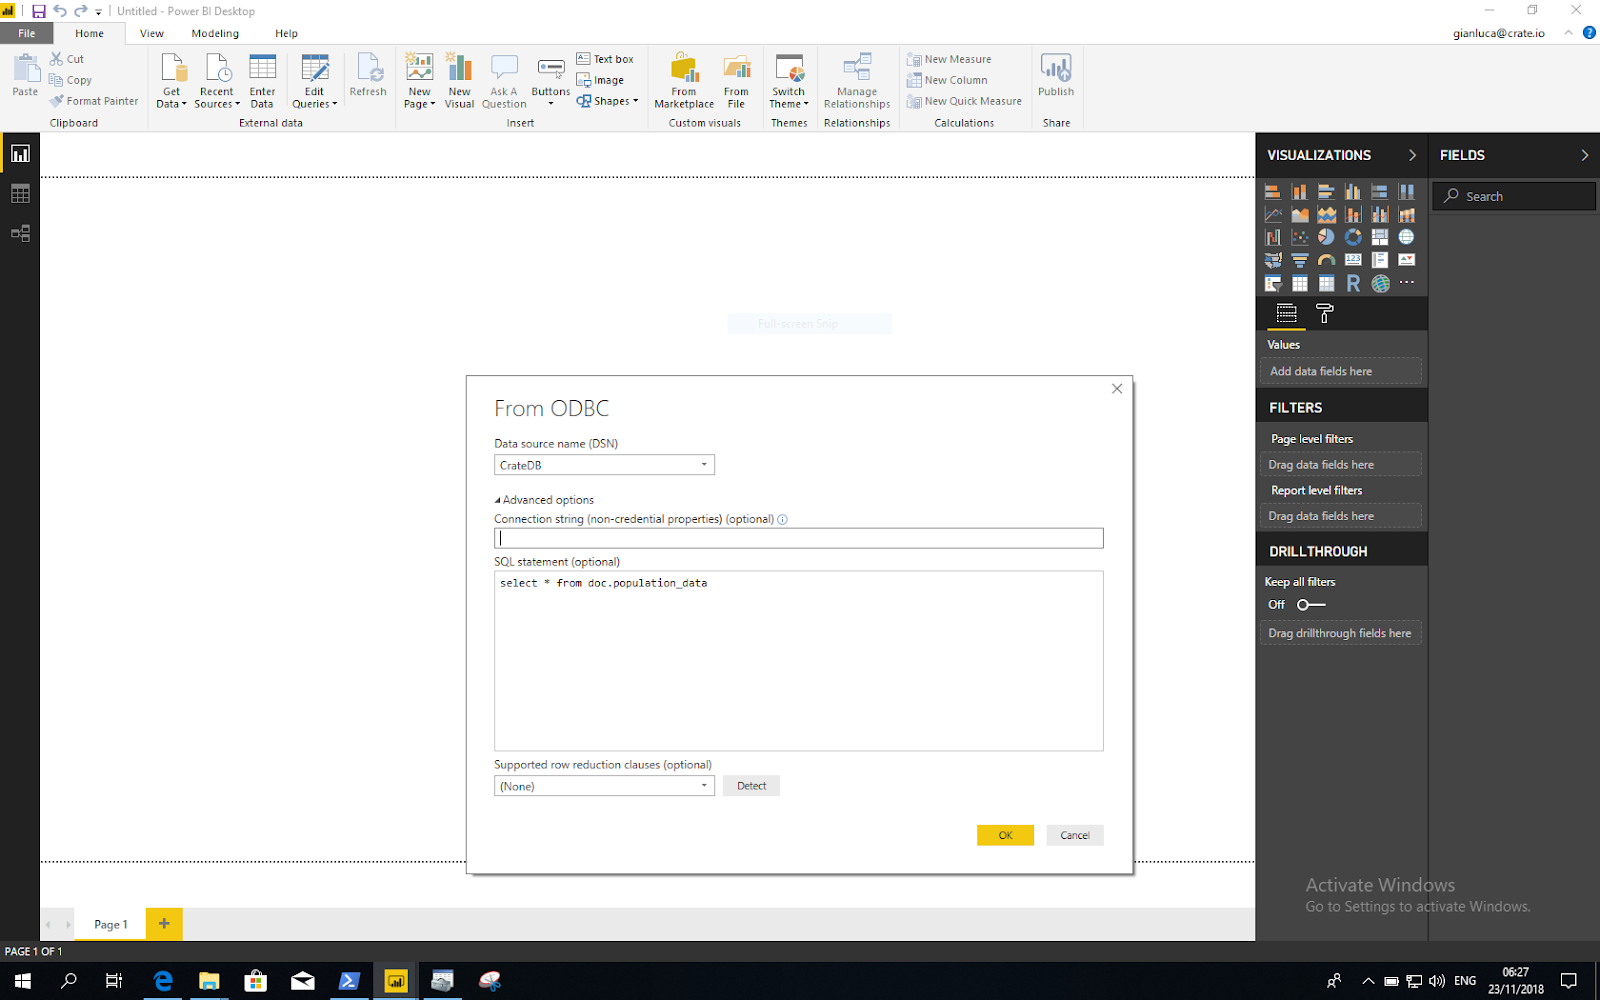
A dialogue window should open that looks like this:

Select the "CrateDB" data source that you created previously.
Before continuing, expand the Advanced options, and enter the following SQL statement:
SELECT * FROM doc.population_data
Your screen should look like this:

In the real world, this setting is a powerful way to extract a manageable amount of data from huge datasets using, e.g., by using WHERE and GROUP BY operators. For us, however, this simple query will suffice.
Once you're done, select OK.
The first time you use an ODBC data source with Power BI, you will be asked to re-authenticate yourself. Enter crate for the username and leave the password blank.
Power BI will probably take a few minutes to import the million-odd records from CrateDB.
Once the import is complete, you should see a preview of the data:

Select Load to continue.
Huzzah! You just imported your first load of CrateDB data into Power BI.
Now, let's do something useful with it...
Create Your First Report
After importing your CrateDB data into Power BI, you will be presented with a white canvas, as before.
However, some values should now appear in the FIELDS panel on the right-hand side:

Next to the FIELDS panel is the VISUALIZATIONS panel. Some icons are displayed, each corresponding to a different sort of visualization.
Select the pie chart visualization.
Then, drag and drop the population field from the FIELDS panel onto the Values section of the VISUALIZATIONS panel.
Finally, drag and drop the region_name field from the FIELDS panel onto the Legend section of the VISUALIZATIONS panel.
The pie chart will update automatically.
After resizing the pie chart box so that it fills the available space, you should see something like this:

Congratulations! You just created your first report using Power BI and CrateDB.
Don't forget to save your report before continuing.
Publish Your Report
Microsoft provides a Power BI service that makes it easy to share the reports you have made with colleagues.
To publish a report, you must have a Power BI service account. If you have a Microsoft work or school account, you can sign up for free. Otherwise, you must have a Power BI Pro trial account.
Select the Publish button from the home ribbon.
Once published, you can access your report via the web:

Importantly, you can copy-and-paste the report URL and share it with anyone.
Taking It Further
Want to play around with a more advanced report?
Here's one I made earlier:

Once downloaded, you can open the report in Power BI, and it should automatically load the dataset I was working with. (Confused? Read on.)
Data Freshness
Many BI solutions query the live data as you view and manipulate reports. However, this can involve setting up hosted BI tools and integrating them into your existing systems, or else, providing access to the live data for anybody in the organization who may want to use desktop BI software.
Fortunately, Power BI bundles a snapshot of the dataset along with the reports you create. So you can be confident that everyone with a copy of the report will have access to (a copy of) the data.
Power BI also allows you to refresh your dataset.
Datasets can be refreshed automatically, manually, or on a schedule.
You can set this up for ODBC using a service gateway.
Alternatively, if you want to create reports that query the data in real-time, you can do so using a mechanism known as DirectQuery. Note, however, DirectQuery has some limitations. For example, the Query Editor is not available, and Data Analysis Expressions (DAX) are not supported.
Note: you will need a bespoke connector for DirectQuery if you want to use it with an ODBC data source. We can help you with this.
Wrap Up
Power BI is a self-service data analytics and visualization tool. And CrateDB is a distributed SQL database. Together, they can provide a powerful end-to-end platform for data warehousing and business intelligence.
In this post, I showed you how to:
- Get CrateDB up-and-running on your local machine
- Import over one million sample records
- Connect Power BI to CrateDB
- Create your first report using Power BI and CrateDB
Questions? Looking for help? Get in touch!


