Live scenario
Industrial IoT
- 1. Choose Scenario
- 2. Get Ready
- 3. Run CrateDB
- 4. Import Data
- 5. Explore Queries
- 6. More Queries
- 7. Connect
- 8. Next Steps
Industrial IoT
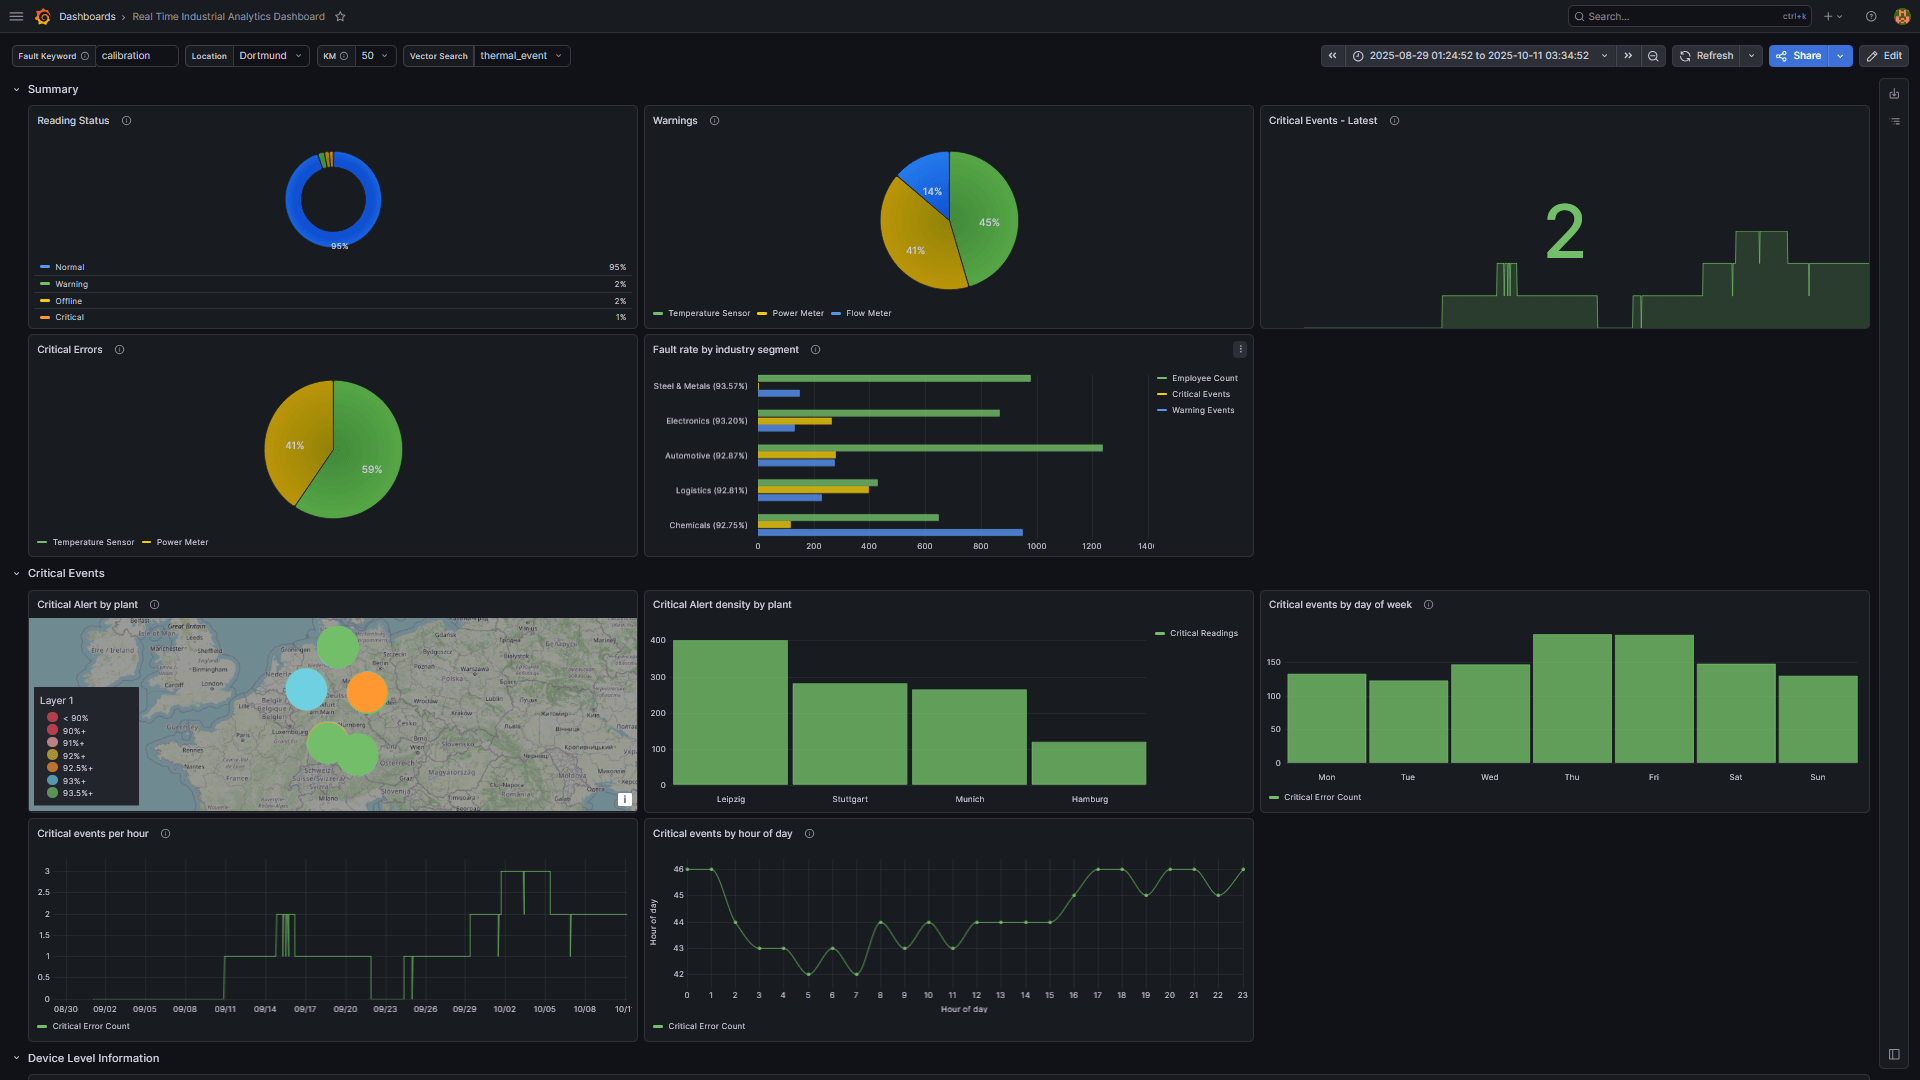
By the end of this path, you will have a live dashboard showing critical events by plant, per hour and per day of the week as well as device level information.
You will work with 500k timestamped and geo-located readings from 5 plants across Germany. Calculate OEE, flag overdue maintenance, surface density alerts by plant, track fault trends by hour, and see aggregated maintenance cost by plant.
Import the dataset into CrateDB, run SQL queries against it, and connect a live Grafana dashboard.
Duration: ~30 minutes
By the end, you’ll understand how to:
- Get the OEE by plant and device type
- Get the aggregated maintenance cost per plant
- Find out which devices are still faulting after maintenance
- Perform full-text search using SQL
- Run hybrid search by combining lexical and semantic search