Visualizing time series data with Grafana and CrateDB
Learn how to build real-time dashboards using CrateDB and Grafana, an open-source platform for data visualization.
This step-by-step tutorial shows you how to get started with CrateDB and Apache Superset, a BI tool for easily organize your data.
Get started with JasperReports Server and CrateDB. Together, they provide a powerful end-to-end platform for real-time business intelligence.
Pair CrateDB with Grafana 6.x, an open-source platform for data visualization. Perfect for working with time-series data.
This tutorial shows you how to get started with CrateDB and DBeaver, a free, open-source tool for developers and database administrators.
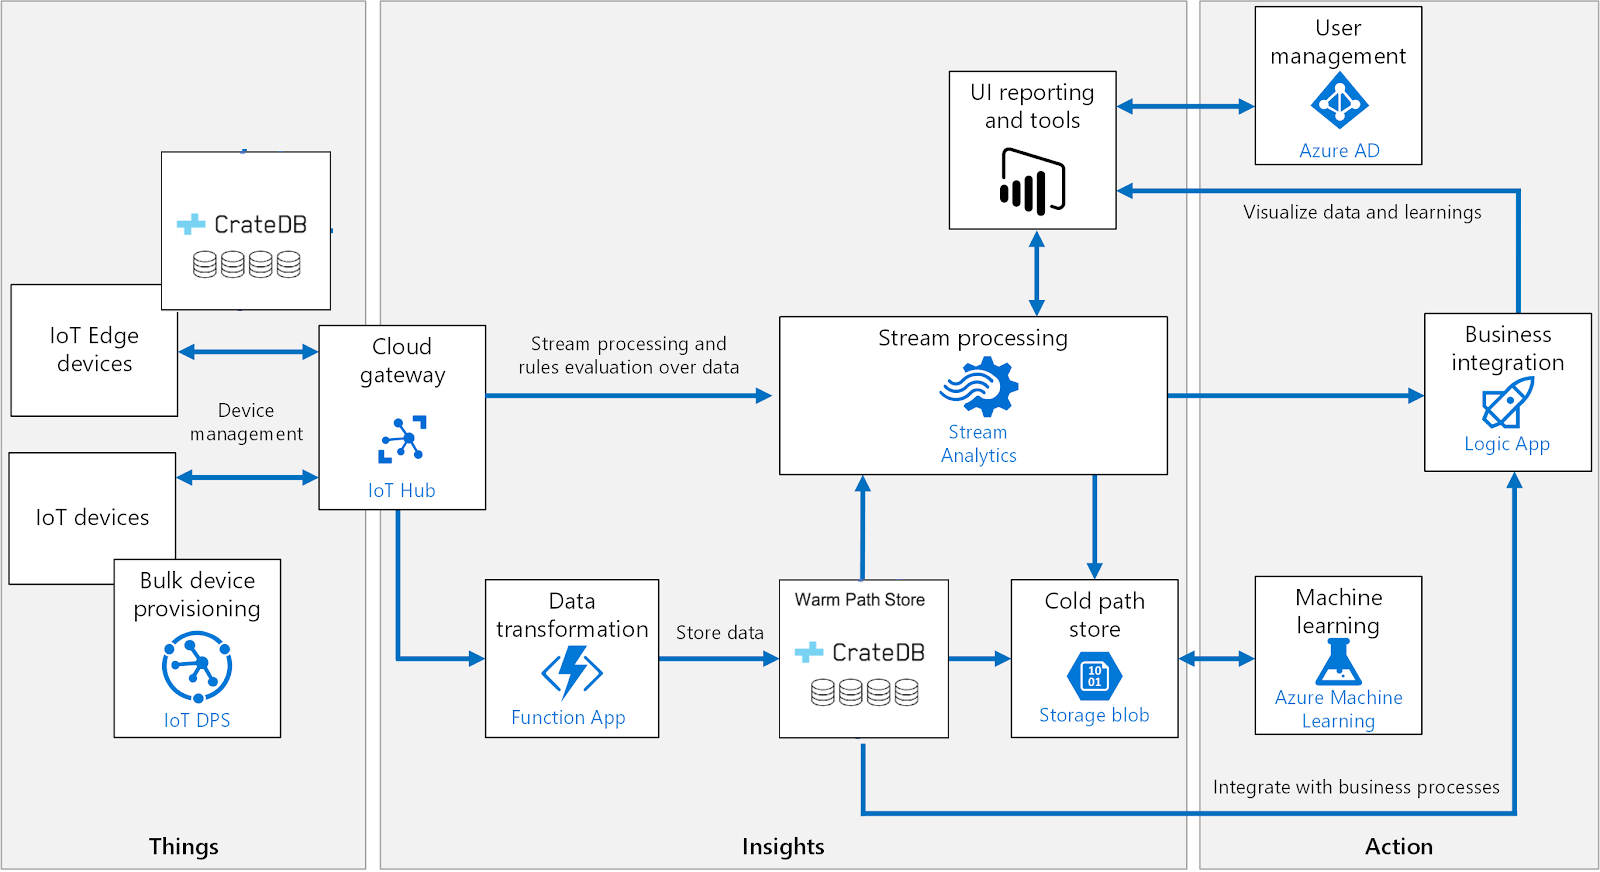
We explain how CrateDB fits into the Azure IoT ecosystem and how it can be used to supercharge your Azure tech stack.
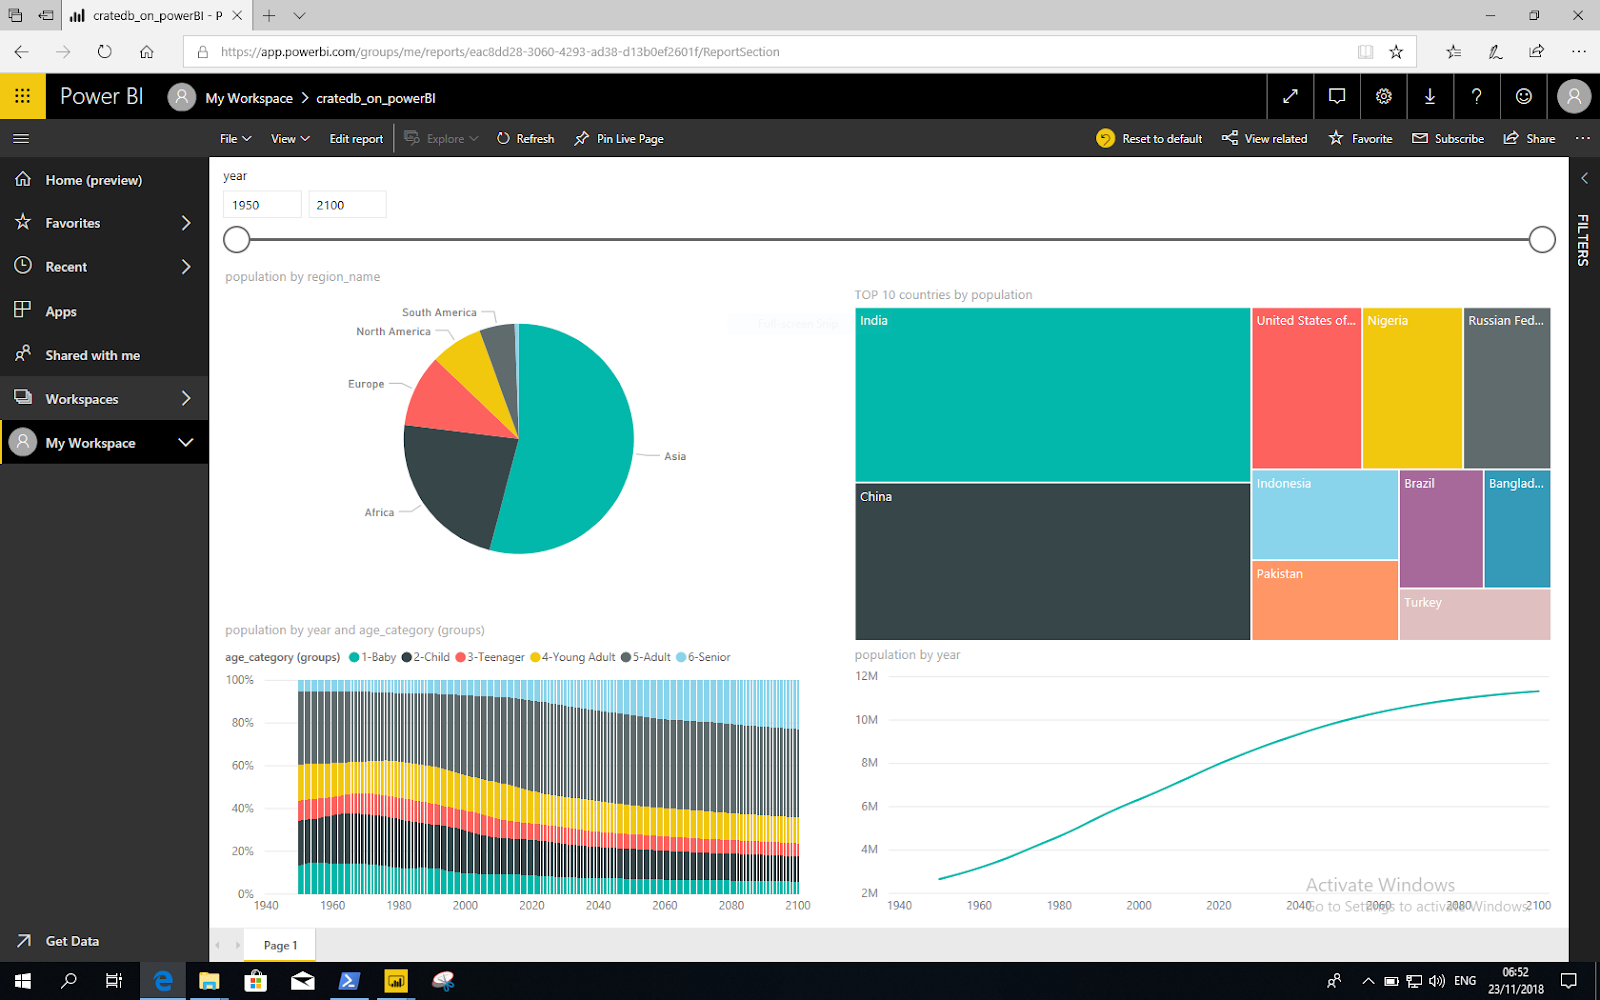
This step-by-step tutorial shows you how to get started with Power BI and CrateDB to easily create reports and dashboards.
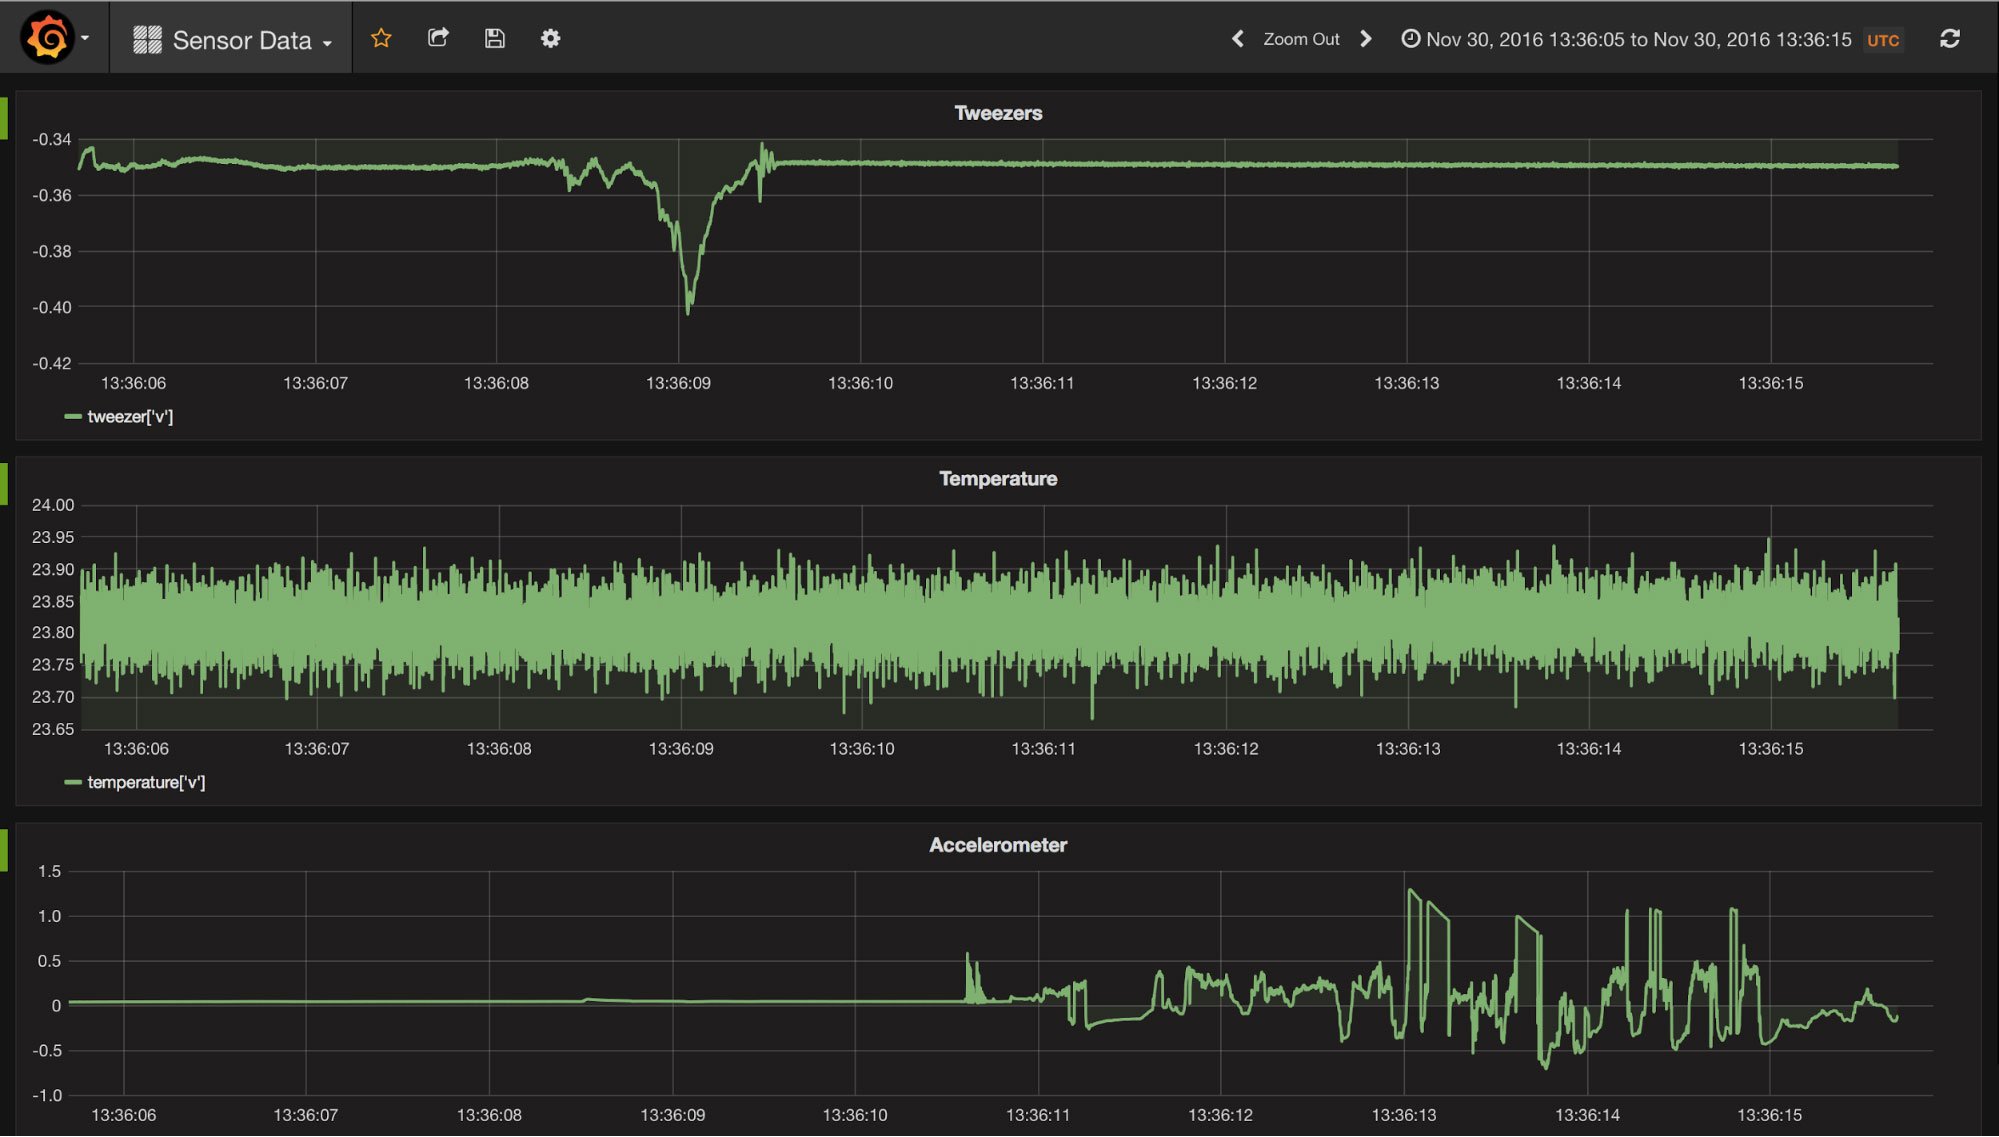
Pair CrateDB with Grafana 5.x, an open platform for data visualization. Perfect for working with time-series data.
In this post I will show you how to get set up with CrateDB and SQLPad on macOS, but these instructions should be trivially adaptable for Linux or Windows.
Because CrateDB supports the PostgreSQL wire protocol, many PostgreSQL clients will work with CrateDB. That includes graphical clients like SQuirreL.