Building a hot and cold storage data retention policy in CrateDB with Apache Airflow
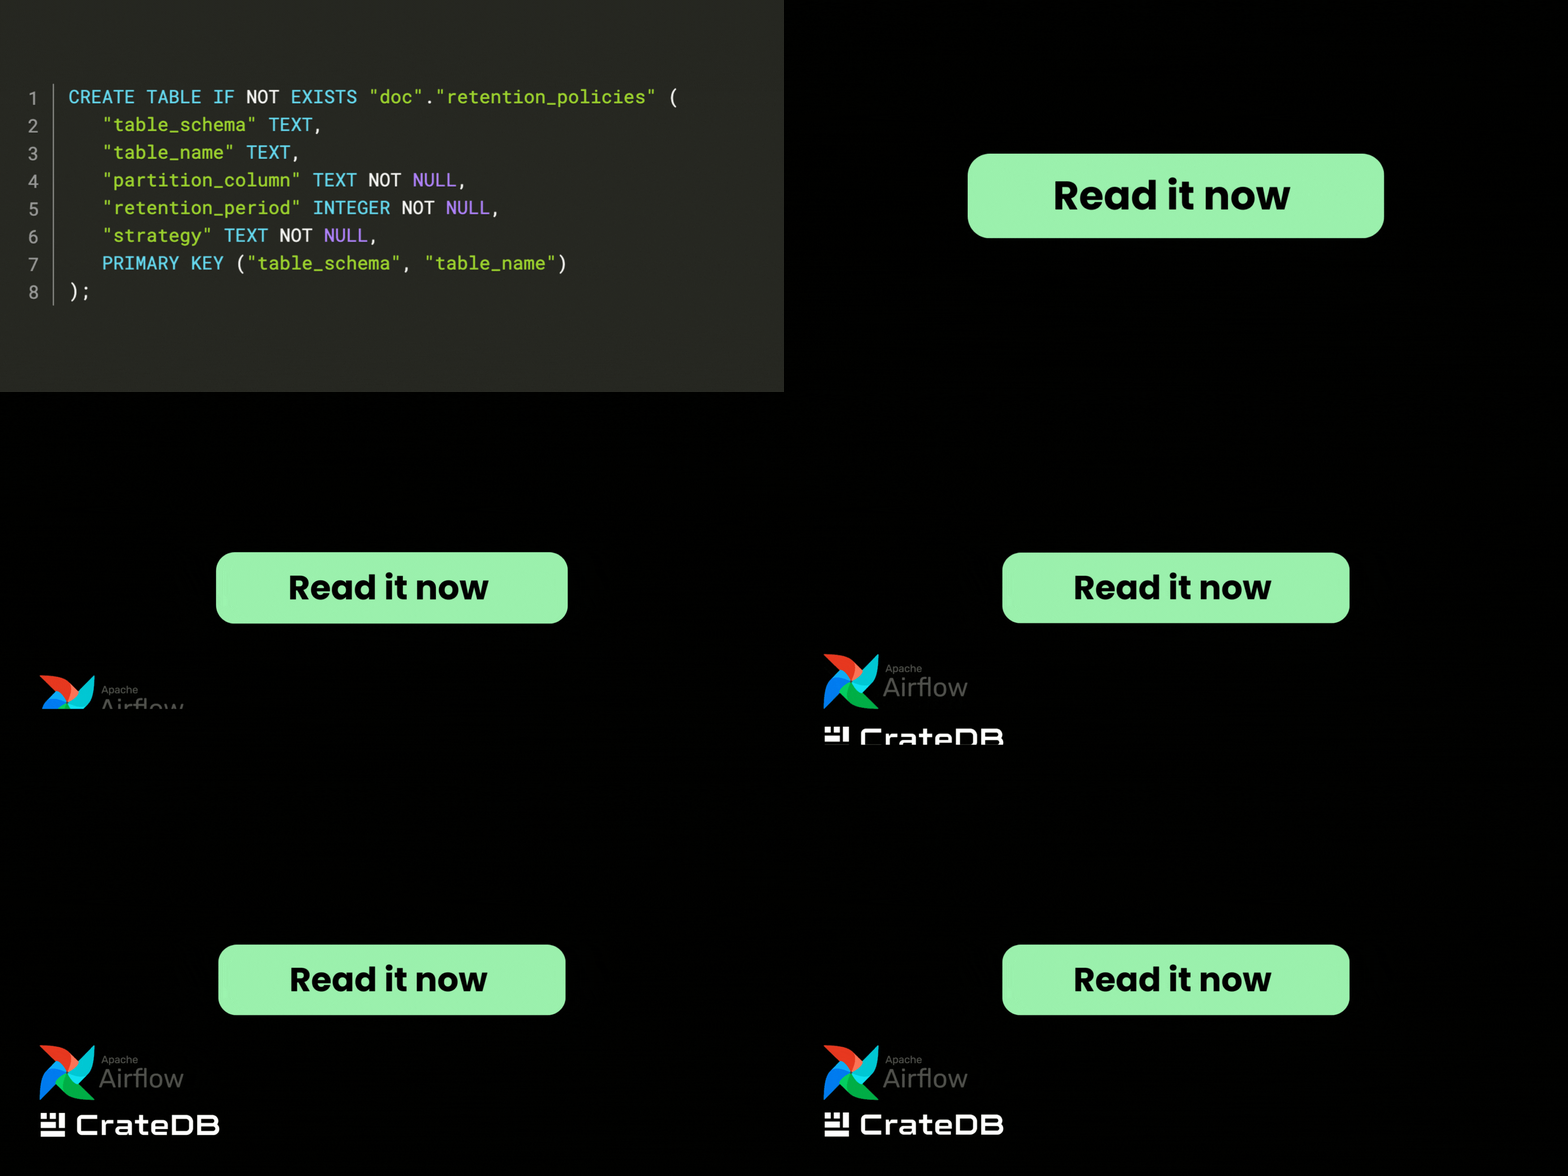
In this article on automating recurrent CrateDB queries with Apache Airflow, our experts will show you a strategy for implementing a data retention policy
In this article on automating recurrent CrateDB queries with Apache Airflow, our experts will show you a strategy for implementing a data retention policy
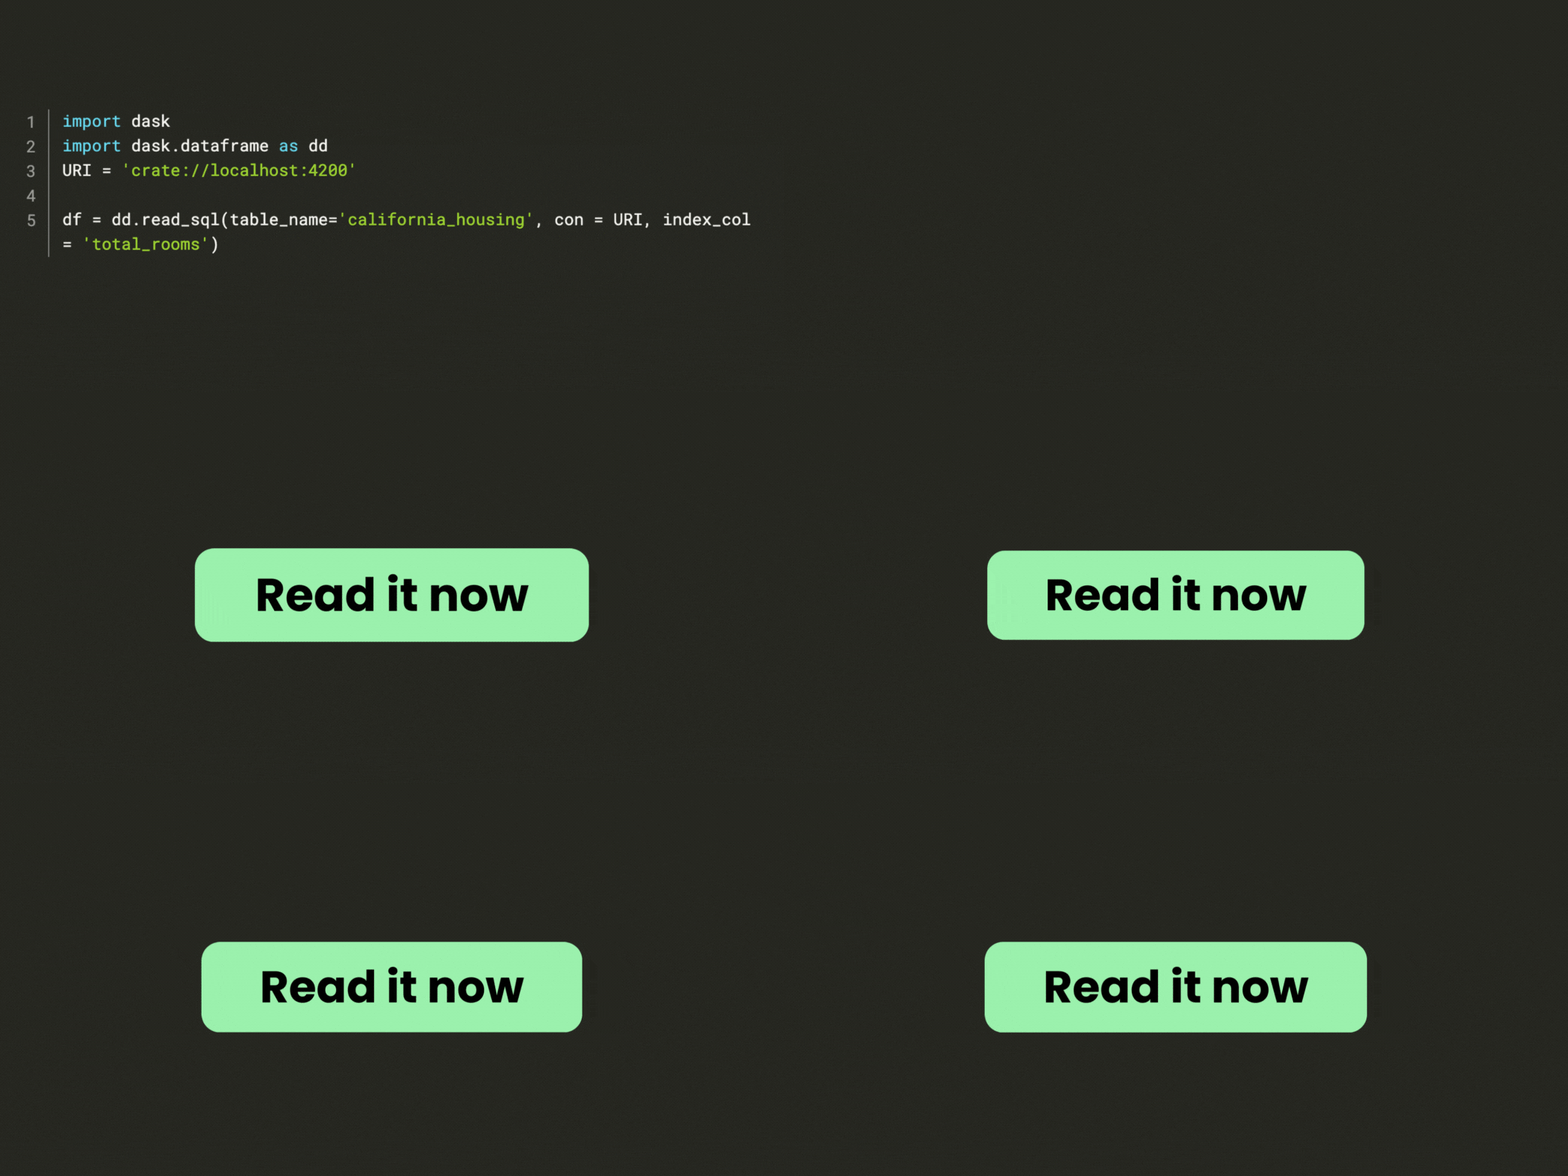
Let's explore how to leverage the power of CrateDB in conjunction with Dask, to perform efficient data processing and analysis tasks!
Leverage the full potential of Apache Airflow with CrateDB, by Niklas Schmidtmer and Marija Selakovic from CrateDB's Customer Engineering team.
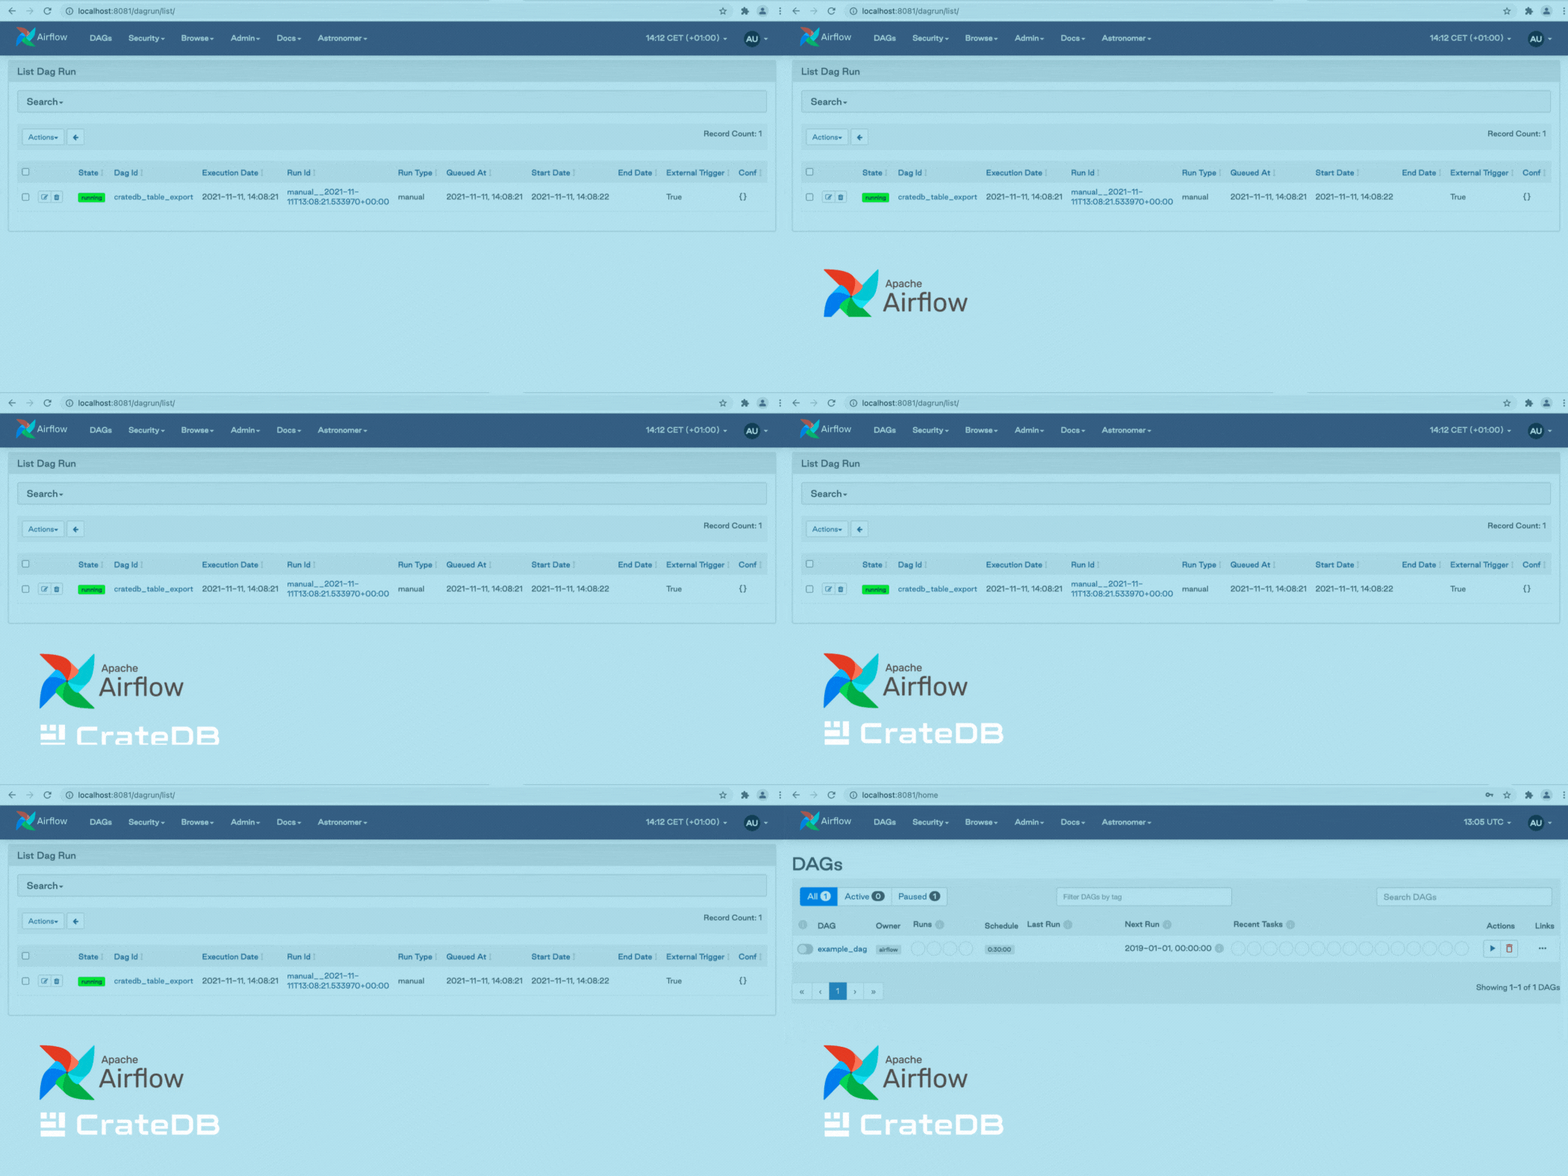
Learn how to harness the power of Apache Airflow with CrateDB, with Niklas Schmidtmer and Marija Selakovic from CrateDB's Customer Engineering team!
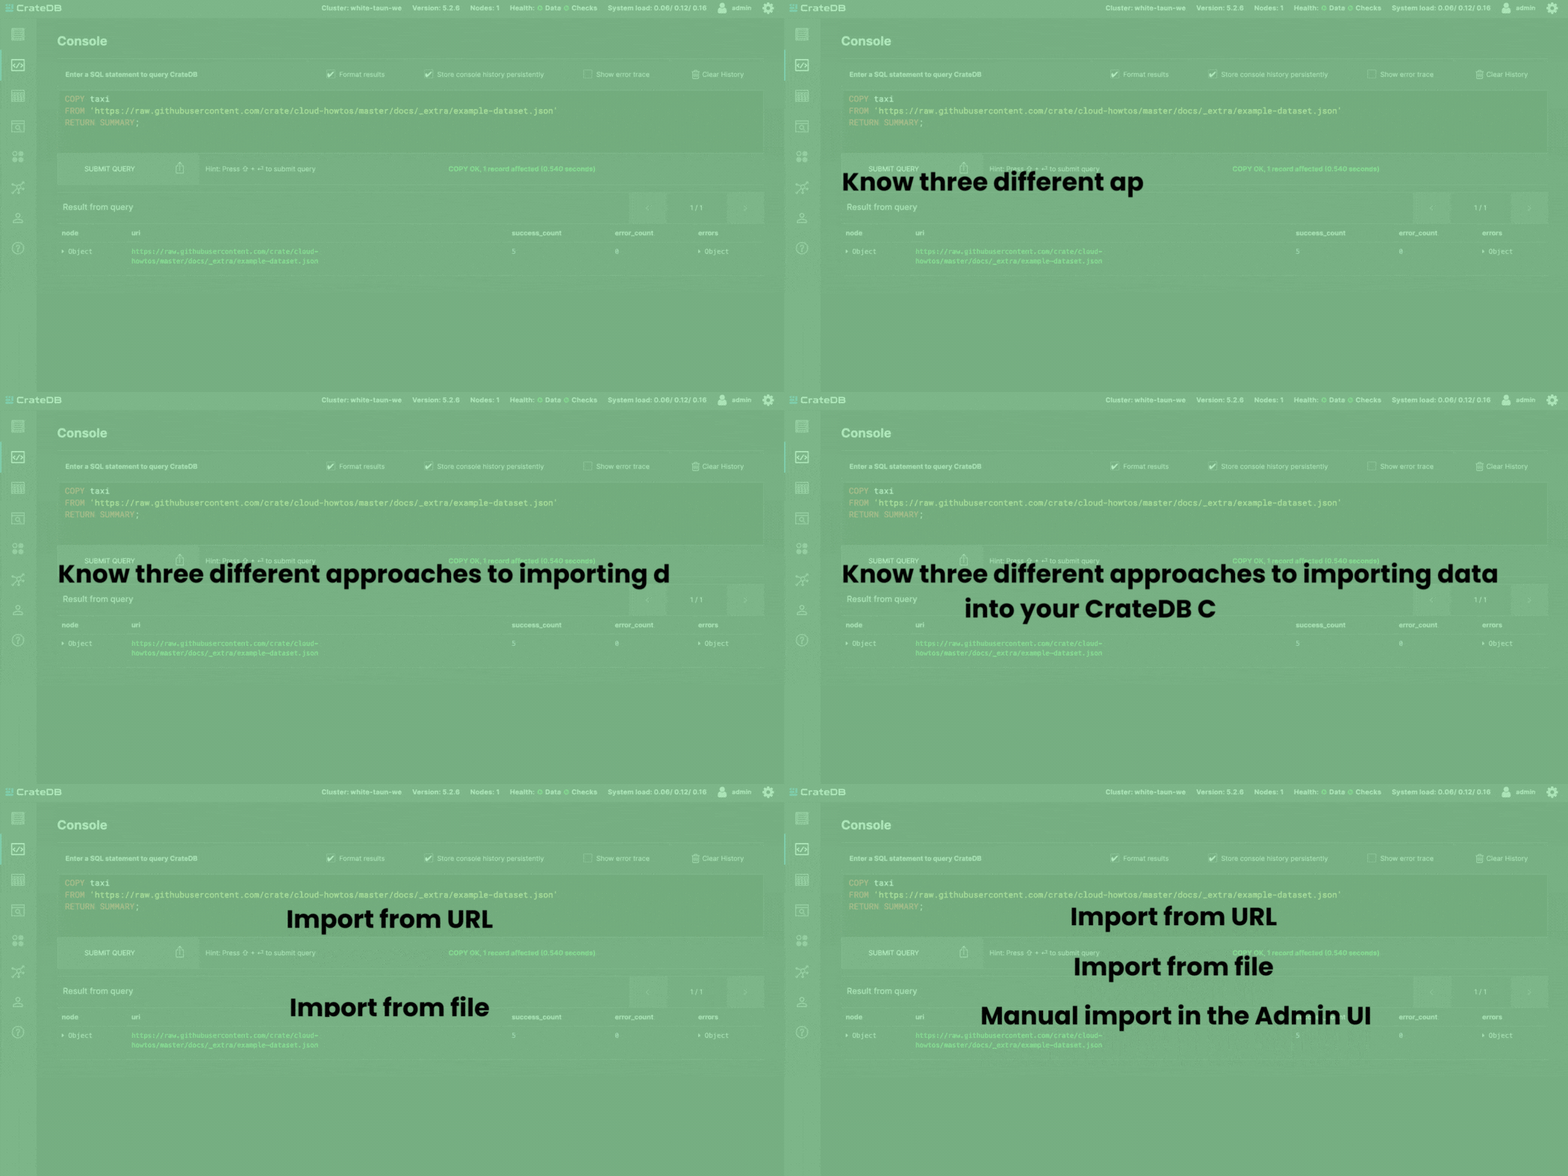
In this tutorial, we'll walk you through three different approaches to importing data into your CrateDB Cloud cluster. Know them now.

In this step-by-step post, we introduce a method to get financial data from stock companies. Learn how to store this data in CrateDB and keep it up to date with companies’ data.

We hope the sunny days are already making an appearance in your region. Check the exciting events and content we've prepared for you👇
Learn how Digital Factory Vorarlberg GmbH uses Apache Camel and CrateDB for collecting, processing, and analyzing the power consumption data of multiple machines.

We've released CrateDB v5.3 focusing on performance, improved ingestion performance by up to 30% and some correlated sub-query performance by up to 10x.
CrateDB's Solution Engineer, Karyn Azevedo, introduces a way to import Parquet files into CrateDB using the Apache Arrow and SQLAlchemy libraries in Python.