Running Crate on Linux and Windows with Azure
How you get started running CrateDB on Linux and Windows with Azure.
How you get started running CrateDB on Linux and Windows with Azure.
The Crate Driver supports all latest versions of Laravel, and eloquent, Laravel's ORM system.
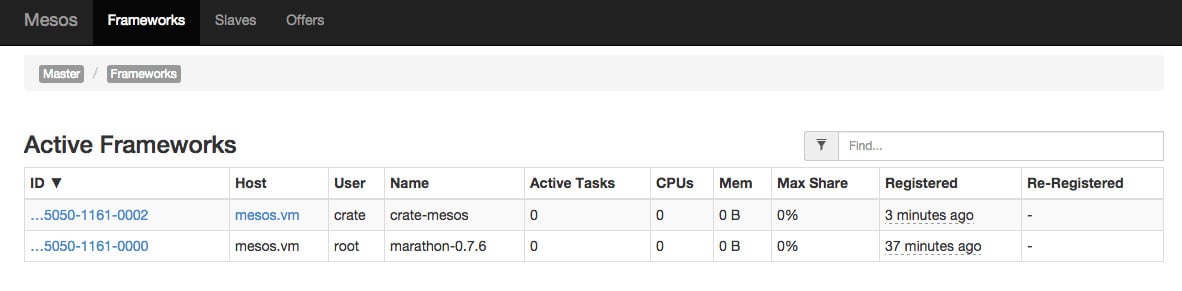
How to get started running and managing CrateDB databases with Mesos.
Using Mesosphere Marathon to manage CrateDB containers makes it easy to deploy a containerized database cluster and allocate database resources quickly
This post will describe how we're using Elasticsearch as part of Crate.