What stays unchanged
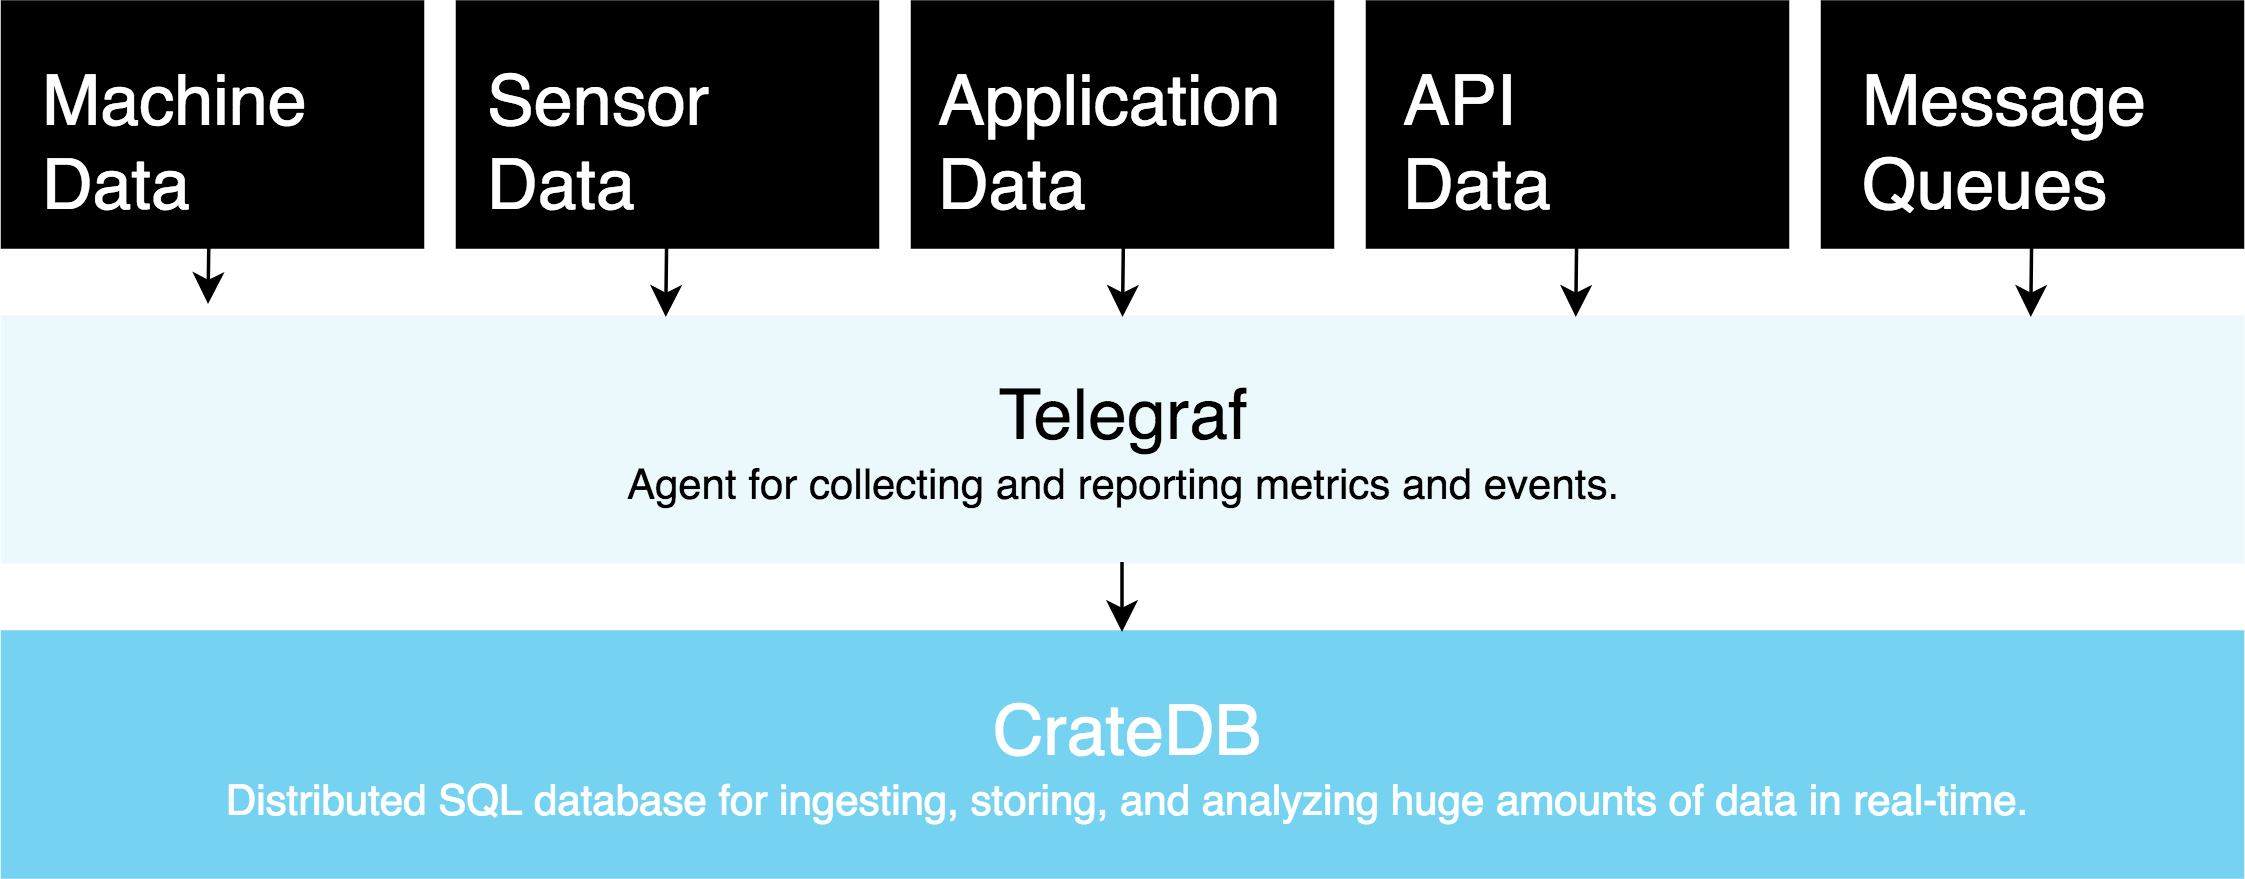
Telegraf separates data collection (inputs) from data delivery (outputs). Input plugins have no dependency on the output destination. An OPC-UA collector does not know or care whether its data goes to InfluxDB or CrateDB.
Here is a standard industrial input block. Nothing in this section changes:
For a full walkthrough of OPC-UA and MQTT input configuration, see How to Ingest OPC-UA and MQTT Data into SQL with Telegraf and CrateDB.
The same applies to MQTT, Modbus, Kafka, and every other input plugin. The collection layer is not part of this migration.
The output plugin swap
InfluxDB 2.x and 3.x (before)
InfluxDB 3.x accepts writes via the same influxdb_v2 line protocol endpoint, so this plugin name does not change between InfluxDB versions. Your current config works as the before-state regardless of which version you are running.
CrateDB (after)
Comment out the [[outputs.influxdb_v2]] block. Add the [[outputs.cratedb]] block. Restart Telegraf.
table_create = true tells CrateDB to create the metrics table on first write. No DDL, no schema setup required before you start.
Connecting to CrateDB Cloud
The local URL above uses the default crate user. For CrateDB Cloud, use your cluster credentials:
Your cluster hostname and credentials are provided in the CrateDB Cloud console.
How CrateDB stores what Telegraf sends
This is the part that will catch you if you skip it.
InfluxDB stores each field as a flat column. CrateDB's Telegraf plugin stores tags and fields in dedicated object columns. The auto-created table schema:
| column_name | data_type |
|---|---|
| hash_id | TEXT |
| timestamp | TIMESTAMP WITH TIME ZONE |
| name | TEXT |
| tags | OBJECT |
| fields | OBJECT |
| day | TIMESTAMP WITH TIME ZONE |
name is the Telegraf measurement name (for example, "opcua" or "cpu"). tags holds all your tag key-value pairs. fields holds all numeric measurements. day is a generated partition column.
This structure handles high-cardinality tag sets and variable field names without schema migrations. When a new sensor type arrives with different fields, Telegraf writes it without a pipeline restart or a schema change. For an industrial stack where sensor configurations change across facilities, this matters.
Querying your data
The query model is standard SQL. The difference from flat-column databases is the bracket notation for accessing values inside the fields and tags objects.
Accessing a field value
Filtering by tag
Time-bucketed aggregation
This pattern maps directly to what Grafana time-series panels expect.
Cross-measurement joins
One query pattern that is not available in InfluxDB becomes possible in CrateDB: joining measurements across different sensor types or time ranges in a single statement.
For teams evaluating the query language transition away from Flux or InfluxQL, Why Industrial Teams Are Moving from Flux and InfluxQL to Standard SQL covers the operational rationale and the SQL patterns in detail.
Verifying the migration
After restarting Telegraf with the new config, confirm data is arriving:
If the table does not exist yet, wait one flush interval (10 seconds by default) and run again. The first write creates the table.
To see which measurement names are present:
Updating Grafana
Grafana connects to CrateDB via its built-in PostgreSQL data source. Add CrateDB as a PostgreSQL source, point it at your cluster, and update your panel queries to use object notation.
Before:
After:
The Grafana time macros ($__timeFilter, $__timeGroup) work with CrateDB via the PostgreSQL wire protocol.
Time estimate
| Step | Time |
|---|---|
Edit telegraf.conf (swap output block) |
5 minutes |
| Restart Telegraf and verify data | 2 minutes |
| Update Grafana queries | 15 to 30 minutes per dashboard |
The pipeline is live in under 10 minutes. Dashboard query updates scale with how many panels reference field or tag columns directly.
What this migration does not change
Your Telegraf inputs. Every plugin (MQTT, OPC-UA, Modbus, Kafka, system metrics) runs identically against CrateDB. Your collection interval stays the same. The outputs.cratedb plugin uses Telegraf's standard metric model.
What changes: the destination URL, and how you reference fields in SQL. Both are visible, mechanical changes.
Next steps
Try this with your own data at cratedb.com/explore. The guided environment has a pre-loaded metrics table so you can test the query patterns before touching your production pipeline.
For the capability comparison that motivated this migration, see CrateDB vs. InfluxDB. For the technical explanation of why high-cardinality industrial workloads degrade in InfluxDB's storage model, see The InfluxDB Cardinality Problem.
For a broader comparison of MongoDB, TimescaleDB, InfluxDB, and CrateDB across industrial IoT criteria, Comparing MongoDB, TimescaleDB, InfluxDB, and CrateDB for Industrial IoT covers the full decision view.