Visualize data with Metabase
This usage guide introduces Metabase, an ultimate data analysis and visualization tool that unlocks the full potential of your data.
Prerequisites
First, you will need a running cluster. You can use Metabase with both CrateDB self-managed and its managed CrateDB Cloud offering.
To use Metabase, you must have an existing data set in your CrateDB cluster. Feel free to use the sample dataset available in the Cloud Console or import your own data similarly to how it’s done in this how-to.
Configure the database connection
Metabase offers both a cloud version and a local installation. E.g.
`shell podman run -d -p 3000:3000 --name metabase docker.io/metabase/metabase:v0.47.13 `
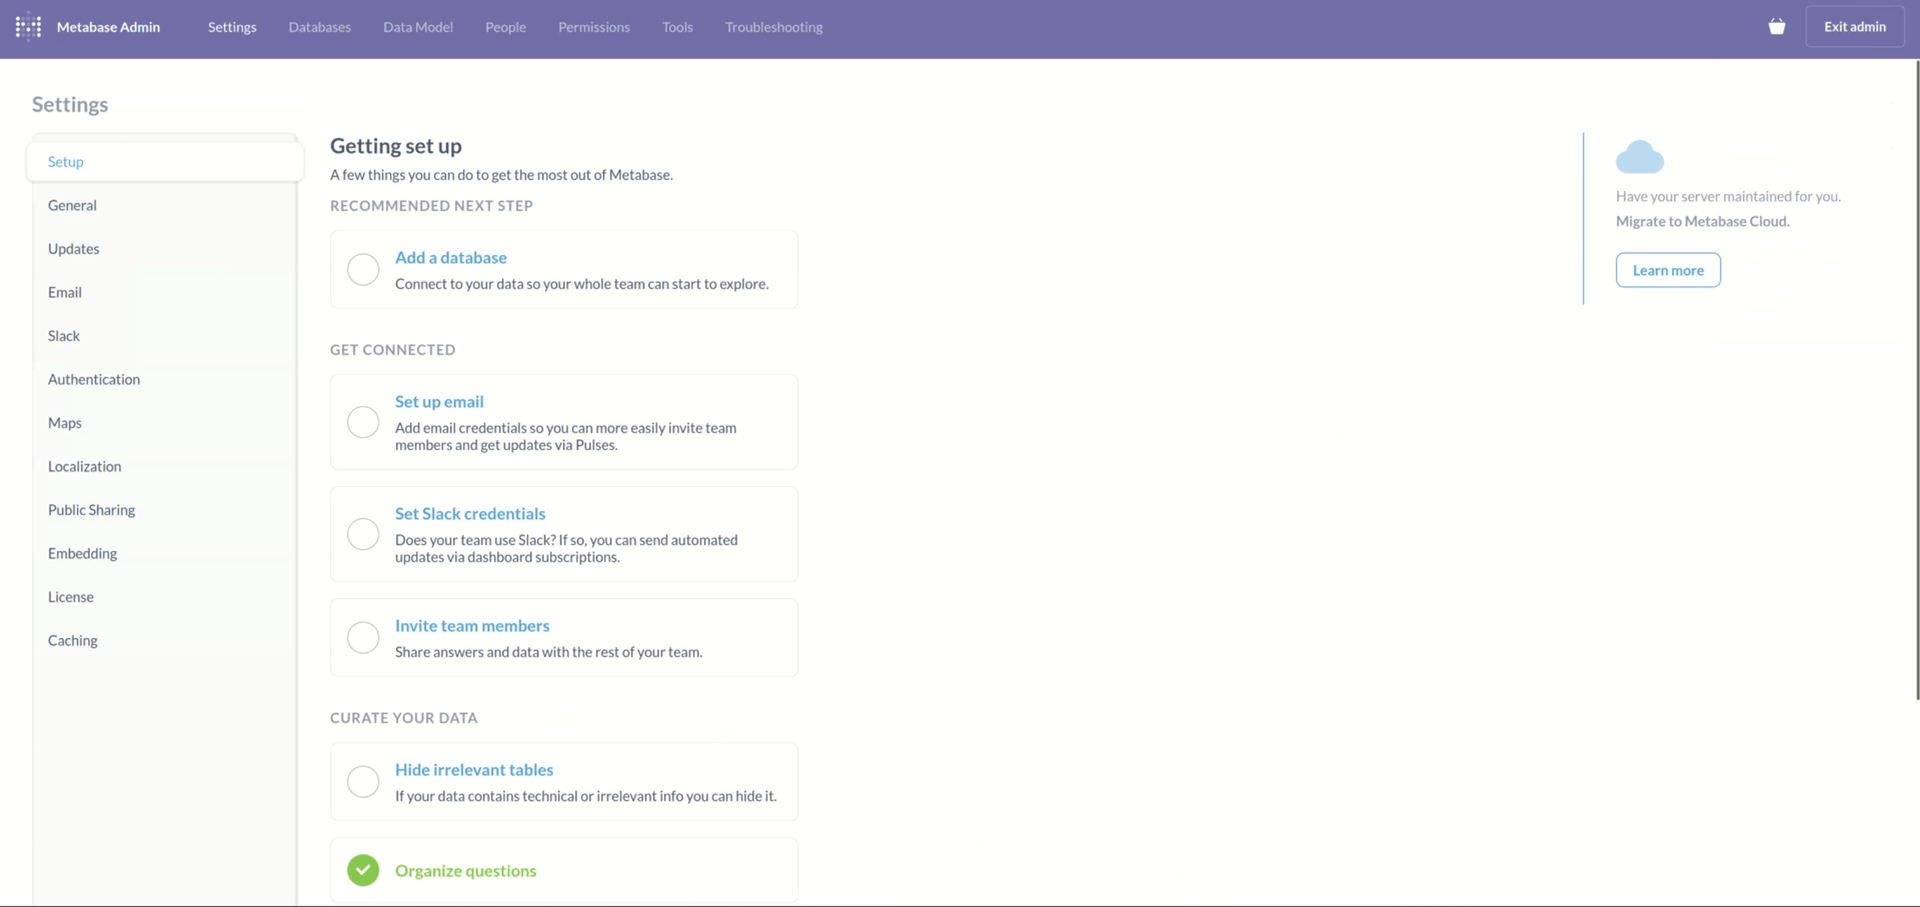
Whichever you choose, the first step will be to add your CrateDB cluster as a
new database. To do that, go to Admin Settings -> Setup and choose
the Add a database option.
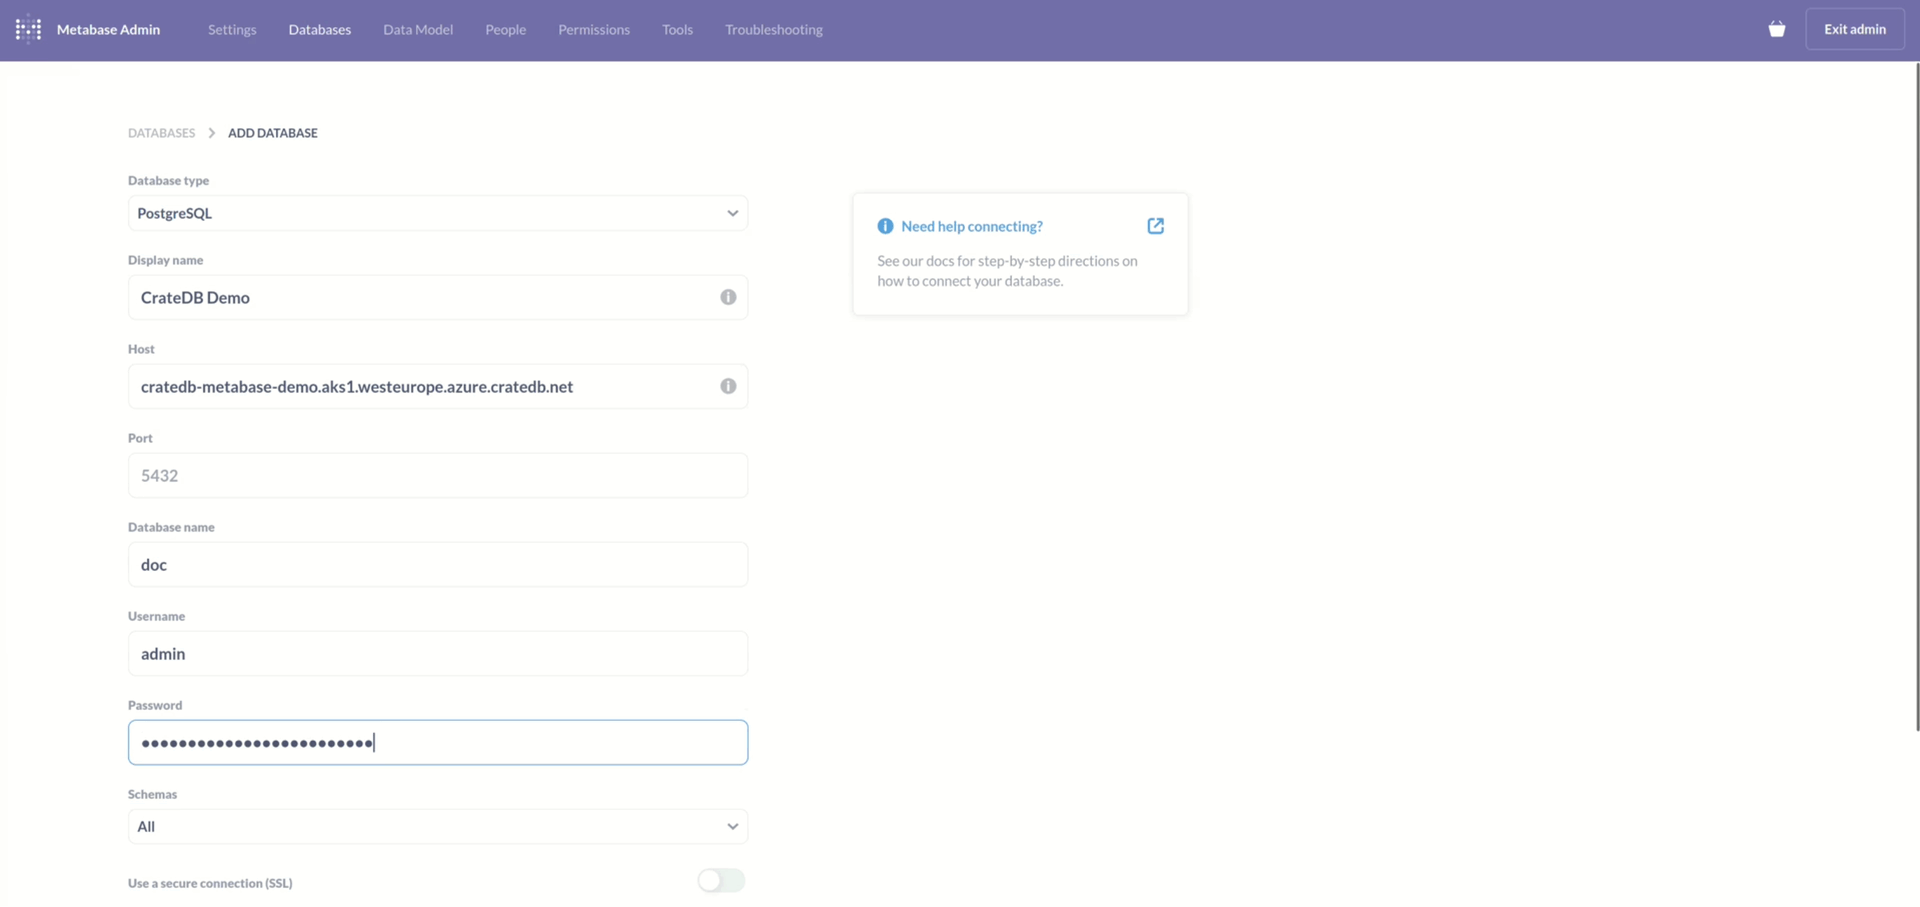
Database configuration is relatively simple, these are the necessary fields:
Database type (PostgreSQL)
Display name
Host (the URI of your cluster)
Database name
Username
Password
Note
Make sure you also select “Use a secure connection (SSL)” option, unless your cluster is not configured for SSL.
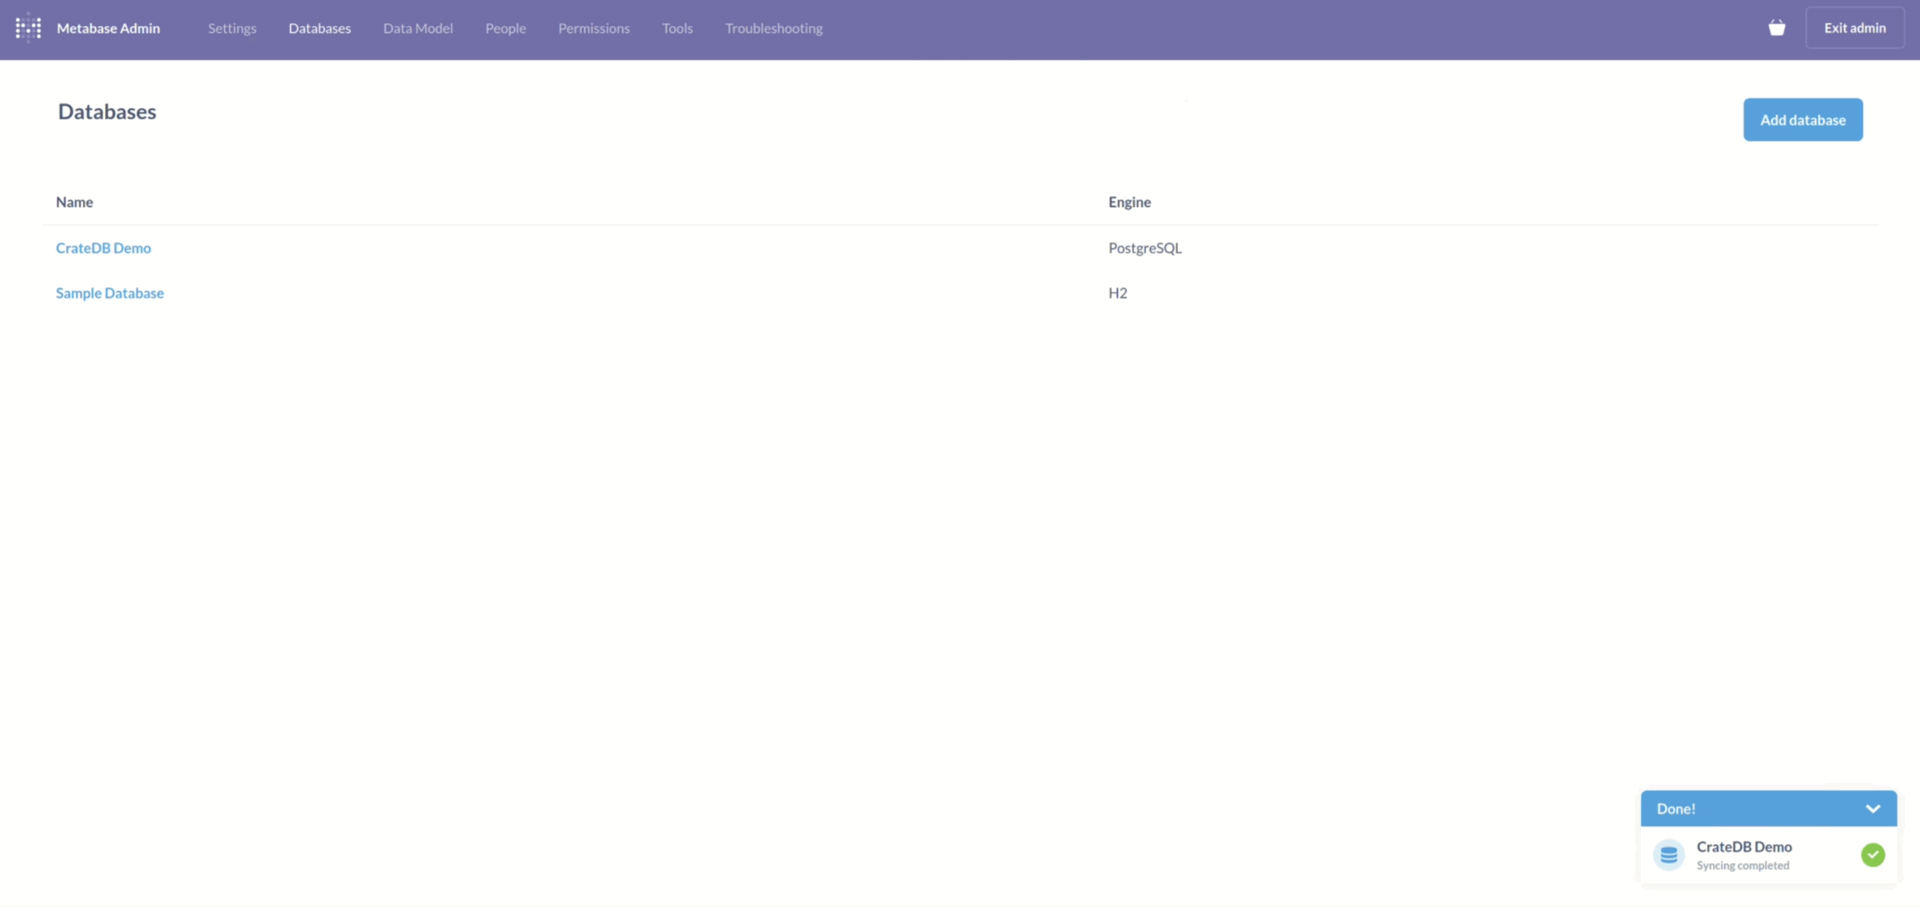
After submitting your details, Metabase will sync with your CrateDB cluster for a few moments. When that completes, you will get a message saying, “Syncing complete”.
Visualize the data
Now you are ready to visualize your data. Metabase works by asking questions.
You ask a question, and Metabase answers it in a visual form. These questions
can then be saved to form dashboards. To ask a question, go to Home and
click on New -> Question in the upper right corner. Then select the
database and a table from it.
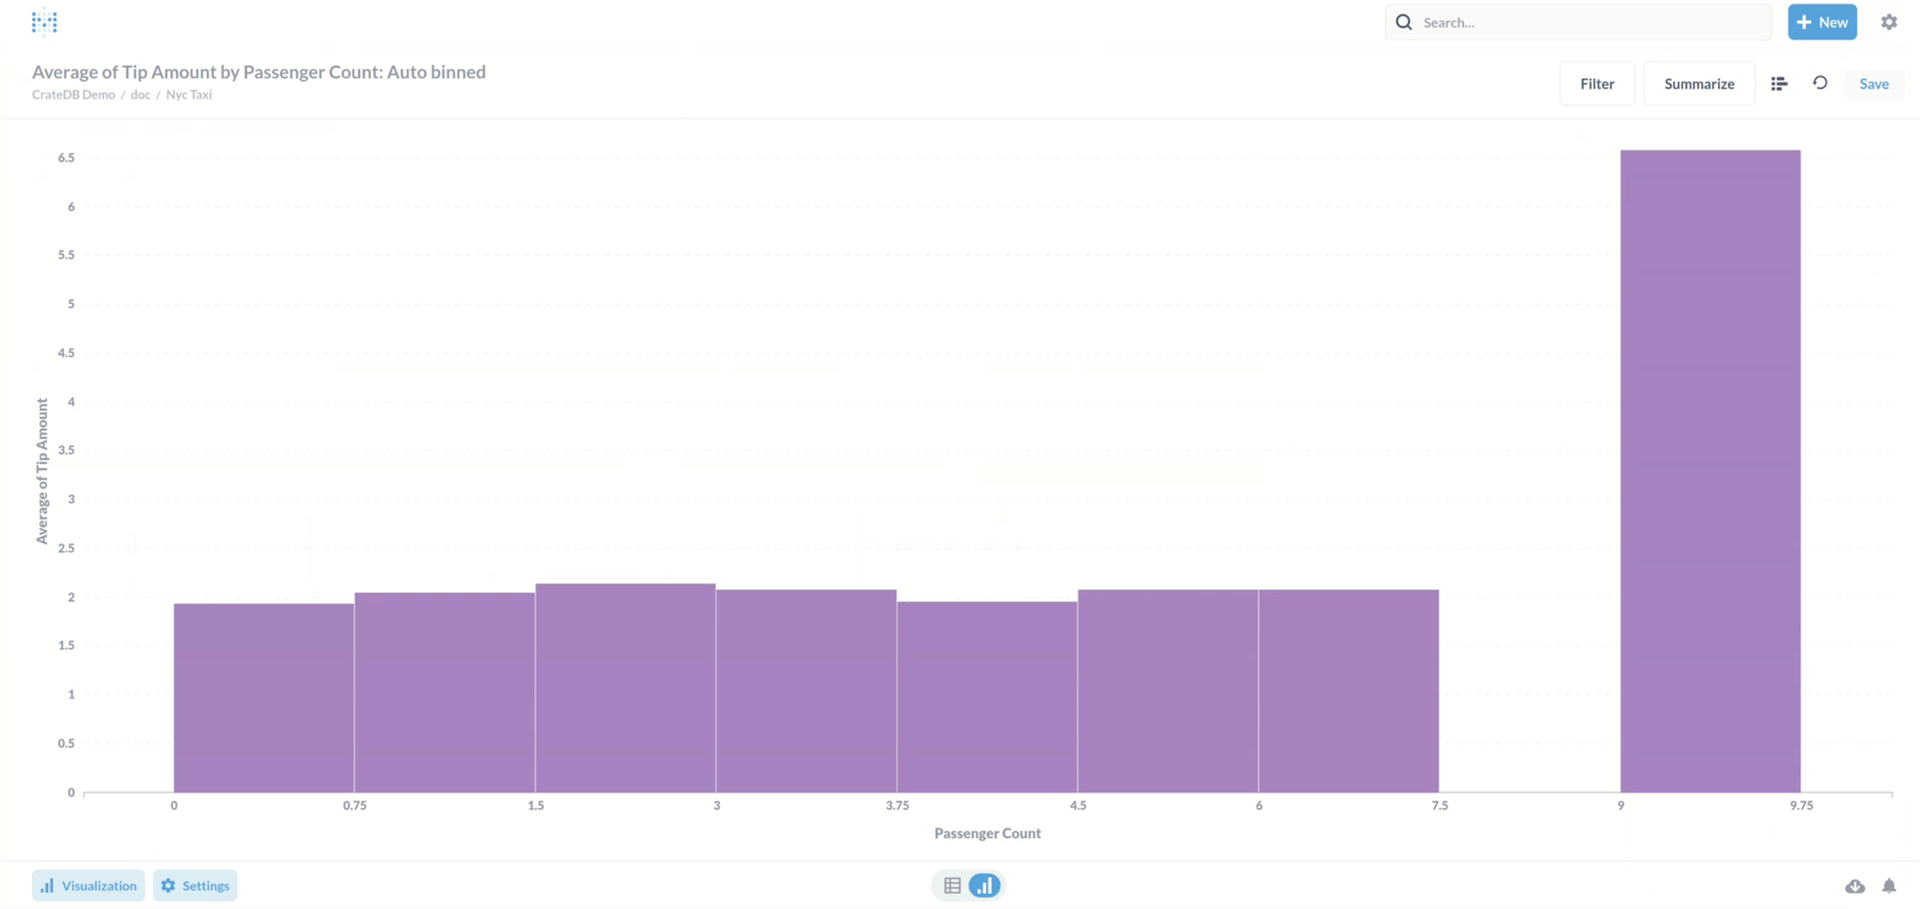
As an example, we ask for the average tip amount, sorted by the passenger count.
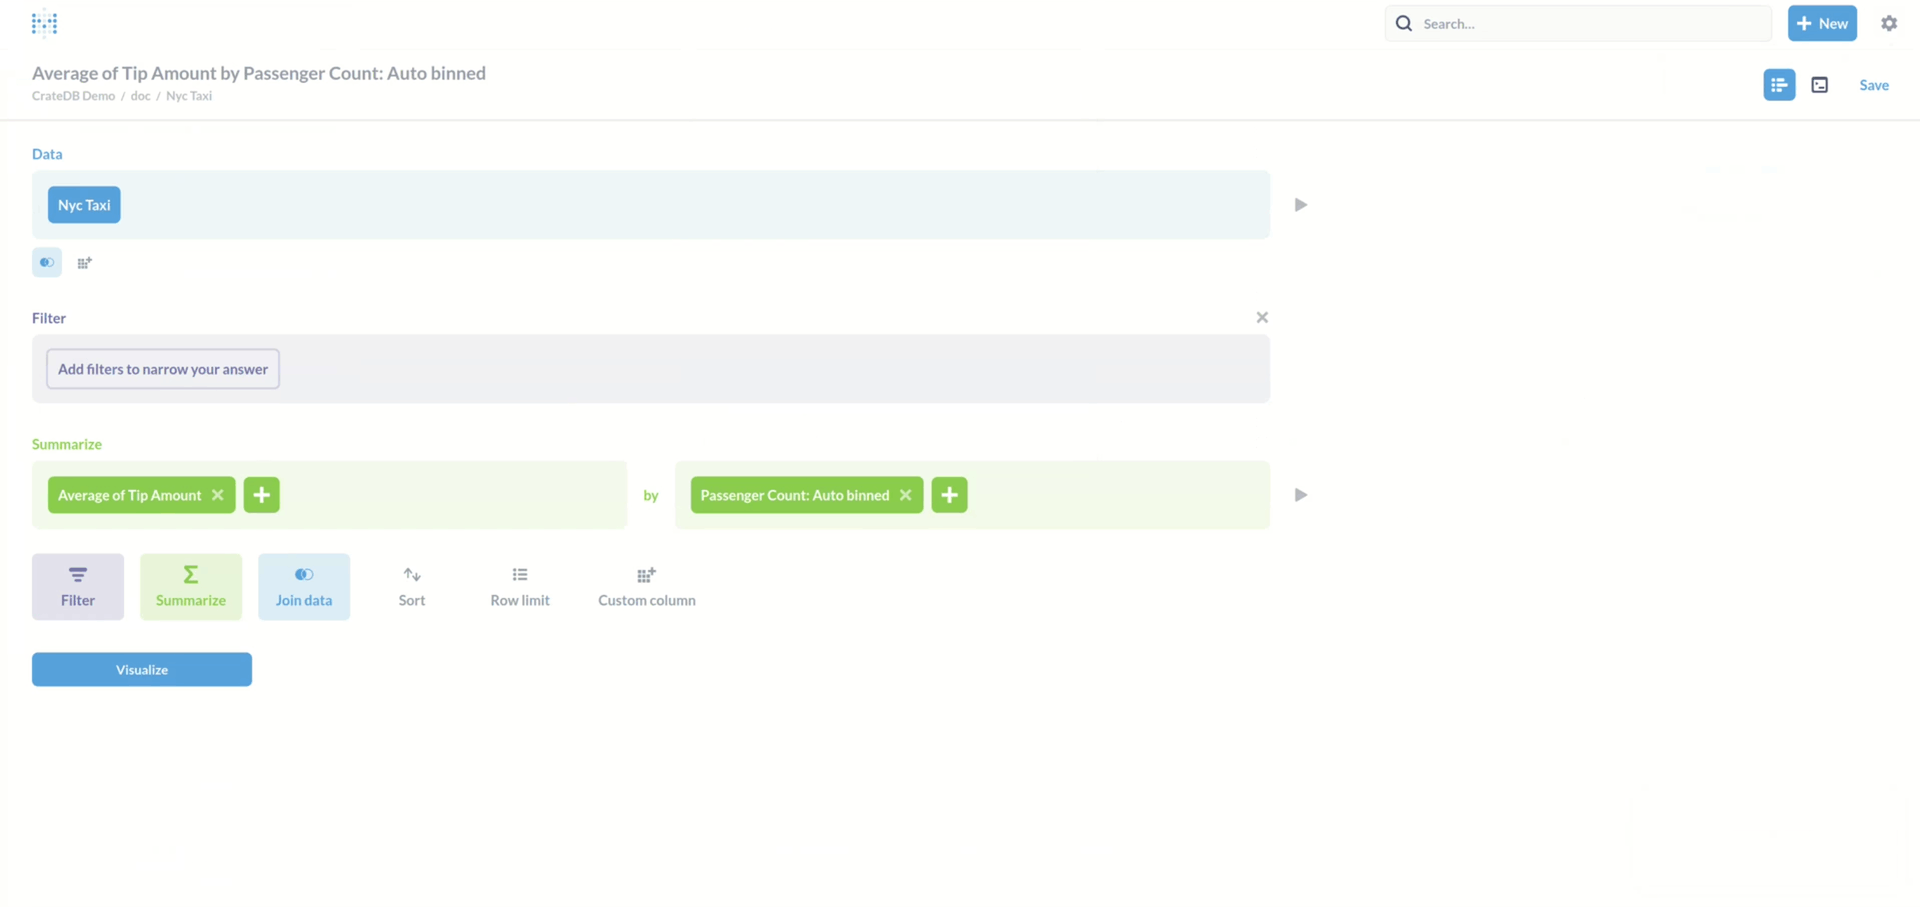
Metabase then provides a visualization of that question.
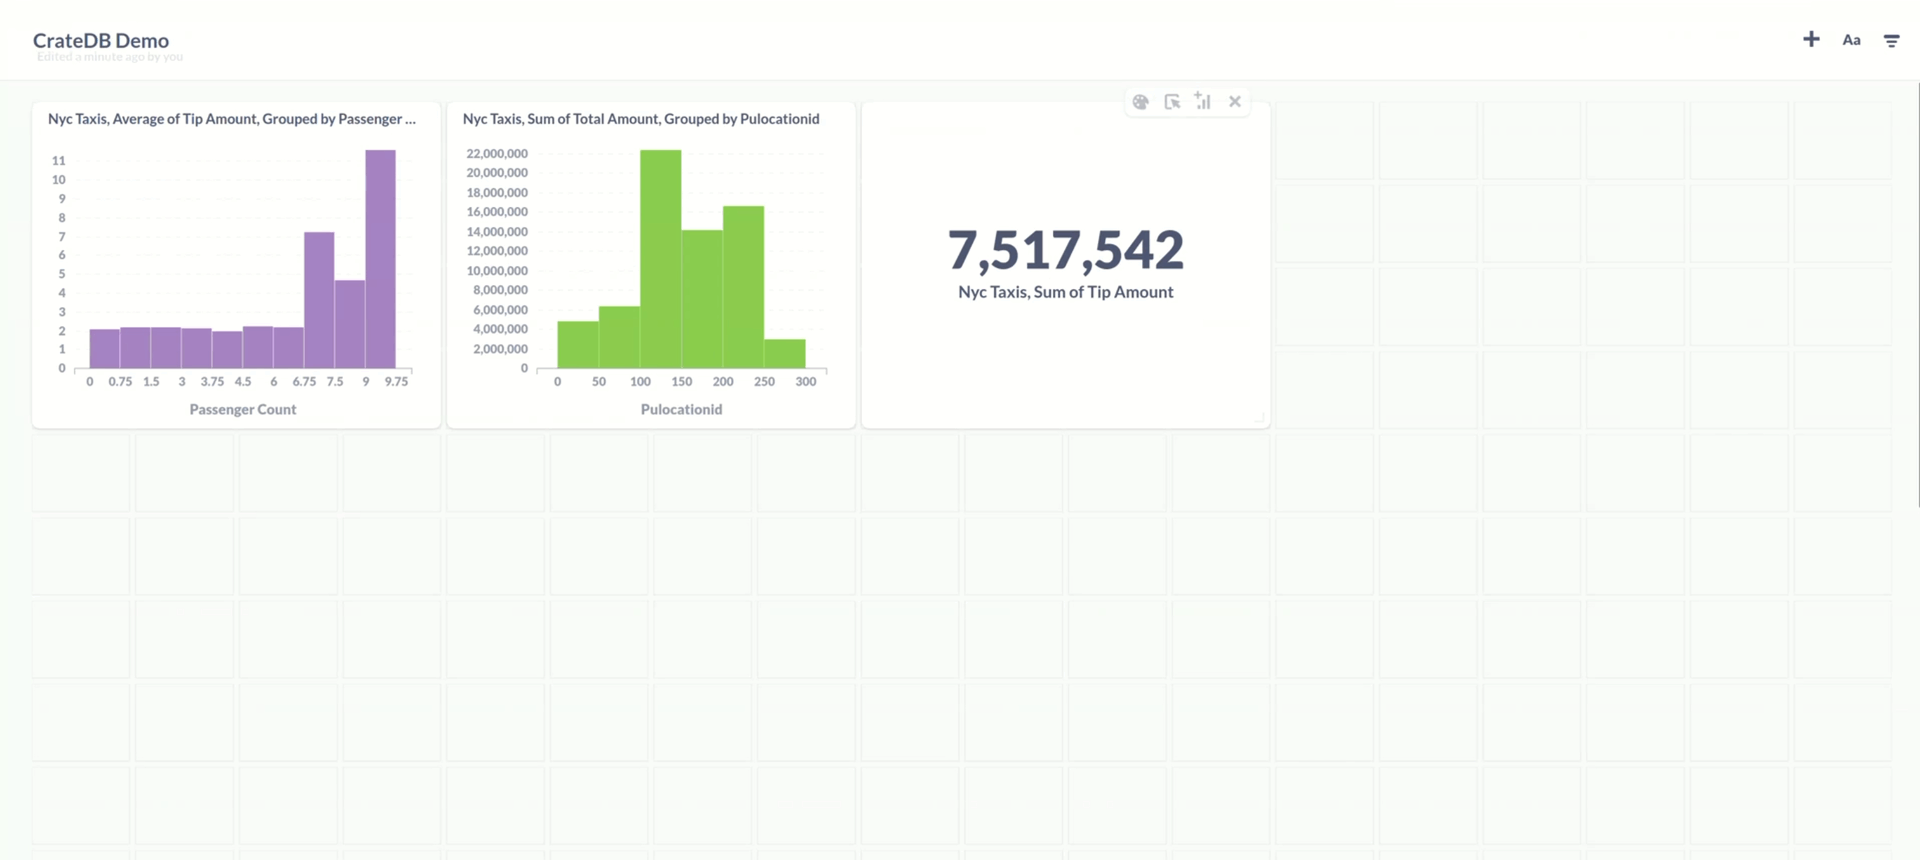
The answer that you get can be saved. When you save a question, you will also be asked if you want to add it to a dashboard. Dashboards provide an easy way to monitor your data.
Conclusion
This was an introductory usage guide into the data visualization tool Metabase. Metabase offers a quick and intuitive way to make sense of your data with interactive dashboards, automated reporting, and more.
If you’d like to see how the other questions were configured, feel free to check out the video tutorial on this topic.
If this integration could benefit you, feel free to head to CrateDB Cloud and get started!