CrateDB Monitoring Dashboard

Niklas Schmidtmer
May 1, 2026
9 min read
This prebuilt Grafana dashboard provides detailed insights into your CrateDB clusters. Metrics can be used for activities such as operational monitoring, capacity planning, as well as incident analysis.
You will get key infrastructure metrics (such as CPU and disk utilisation), as well as database-specific metrics. We will also demonstrate how to add any custom SQL-based metrics.
The currently support deployment methods for this monitoring setup are:
CrateDB Cloud: Clusters running in any CrateDB Cloud region
Prometheus Node Exporter: Self-managed clusters where CrateDB is running on a dedicated VM or bare-metal host.
Dashboard Overview
The dashboard includes:
Cluster health and availability
CPU, memory, and disk utilisation
Node and container metrics
Database connection and query statistics
Custom SQL-derived metrics via
sql_exporter(optional)
Setup Steps
This section guides you through the individual setup steps and prerequisites.
Please consider security aspects depending on your setup. Exporters typically expose metrics without authentication. Restrict network access appropriately, for example via firewalls, VPNs, or private networking.
Prometheus
Prometheus is used to scrape and store metrics from CrateDB. It is responsible for creating historical metric data over time, since the different monitoring endpoints will always return the latest values at that time.
Please install Prometheus from your distribution’s package manager or consider Prometheus’ Installation guide. We will configure scraping later on.
The dashboard uses normalised labels (cratedb_cluster and cratedb_node) across different monitoring sources to provide consistent filtering and dashboard variables. You will find corresponding rules in the setup instructions which are essential to include.
Optional: sql_exporter
sql_exporter is an exporter that connects to databases such as CrateDB, captures metrics, and returns them in a Prometheus format. We use it to complement monitoring data with additional metrics that can be derived from your individual data model or to run additional queries on CrateDB’s system tables.
There are multiple exporters named sql_exporter. This dashboard uses the implementation from https://github.com/burningalchemist/sql_exporter.
To access your CrateDB Cloud cluster, it is a good idea to create a separate user with minimal permissions. The exporter only requires read-only access. To create a user, run these commands:
CREATE USER sql_exporter WITH (password = '...');
GRANT DQL ON SCHEMA sys TO sql_exporter;
-- grant DQL on additional schemas/tables if you intend to query other tables
In your /etc/prometheus/prometheus.yml, add a section to scrape_configs to capture metrics from sql_exporter:
- job_name: "sql_exporter"
  static_configs:
    # localhost is the host on which sql_exporter is running
    - targets: ["localhost:9399"]
Your custom queries can be configured in /etc/sql_exporter/cratedb.collector.yml, for example:
collector_name: cratedb

metrics:
  - metric_name: cratedb_sql_nodes
    type: gauge
    help: "Number of nodes in the cluster"
    values: [node_count]
    query: |
      SELECT COUNT(*) AS node_count
      FROM sys.nodes;
Grafana
Grafana will connect to Prometheus to display metrics over time. Please see Grafana’s Download page for options to install Grafana. The OSS edition will be sufficient for our purposes.
Prometheus data source
Follow the steps outlined in the Grafana documentation to add a new Prometheus data source, pointing to the Prometheus instance previously set up.
Deployment-specific steps
Depending on your deployment method, please follow instructions in the respective file. Once done, follow the remaining steps.
The CrateDB Cloud API provides an endpoint with curated metrics which we will scrape and ingest into Prometheus.

Setup Steps
This section guides you through the CrateDB Cloud-specific setup steps and prerequisites.
CrateDB Cloud API access
Create an API key from the account page to access the CrateDB Cloud API. Detailed steps can be found in the documentation.
Prometheus
Add an entry to the scrape_configs section in /etc/prometheus/prometheus.yaml:
scrape_configs:
  - job_name: "cratedb_cloud"
    # Metrics are cached for 1 minute by the CrateDB Cloud API.
    # Scraping more frequently will not provide higher-resolution data.
    scrape_interval: 1m
    static_configs:
      - targets: ["console.cratedb.cloud"]
    metrics_path: "/api/v2/organizations/<Organization ID>/metrics/prometheus/"
    basic_auth:
      username: "<CrateDB Cloud API key>"
      password: "<CrateDB Cloud API secret>"
    # Different CrateDB Cloud metrics expose cluster and node identifiers under slightly different label names.
    # These relabeling rules normalize them into `cratedb_cluster` and `cratedb_node`.
    metric_relabel_configs:
      - source_labels: [namespace]
        target_label: cratedb_cluster
        regex: "(.+)"
        replacement: "$1"

      - source_labels: [exported_namespace]
        target_label: cratedb_cluster
        regex: "(.+)"
        replacement: "$1"

      - source_labels: [pod_name]
        target_label: cratedb_node
        regex: "(.+)"
        replacement: "$1"

      - source_labels: [pod]
        target_label: cratedb_node
        regex: "(.+)"
        replacement: "$1"
Replace placeholders accordingly:
<Organization ID>: Your CrateDB Cloud organization ID. Select your organization from the dropdown at the top right of the Cloud Console and navigate to the “Settings” page to obtain the organization ID.<CrateDB Cloud API key>: The key part of the CrateDB Cloud API key generated earlier.<CrateDB Cloud API secret>: The secret part of the CrateDB Cloud API key generated earlier.
Reload or restart Prometheus after changing the configuration (for example, systemctl restart prometheus.service).

Grafana
In Grafana, when setting up the Prometheus data source, set the scrape interval to 1m. This should match the Prometheus scrape interval used for CrateDB Cloud metrics. It ensures Grafana variables such as $__rate_interval work correctly with the available metric resolution.
Optional: sql_exporter
If you want to use sql_exporter for custom queries, add a jobs section to /etc/sql_exporter/sql_exporter.yml, so your configuration looks like below:
jobs:
  - job_name: db_targets
    collectors: [cratedb]
    static_configs:
      - targets:
          cratedb: "postgresql://<CrateDB username>:<CrateDB password>@<CrateDB hostname>:5432/doc"
        labels:
          cratedb_cluster: "<Project ID>"
Replace the following placeholders:
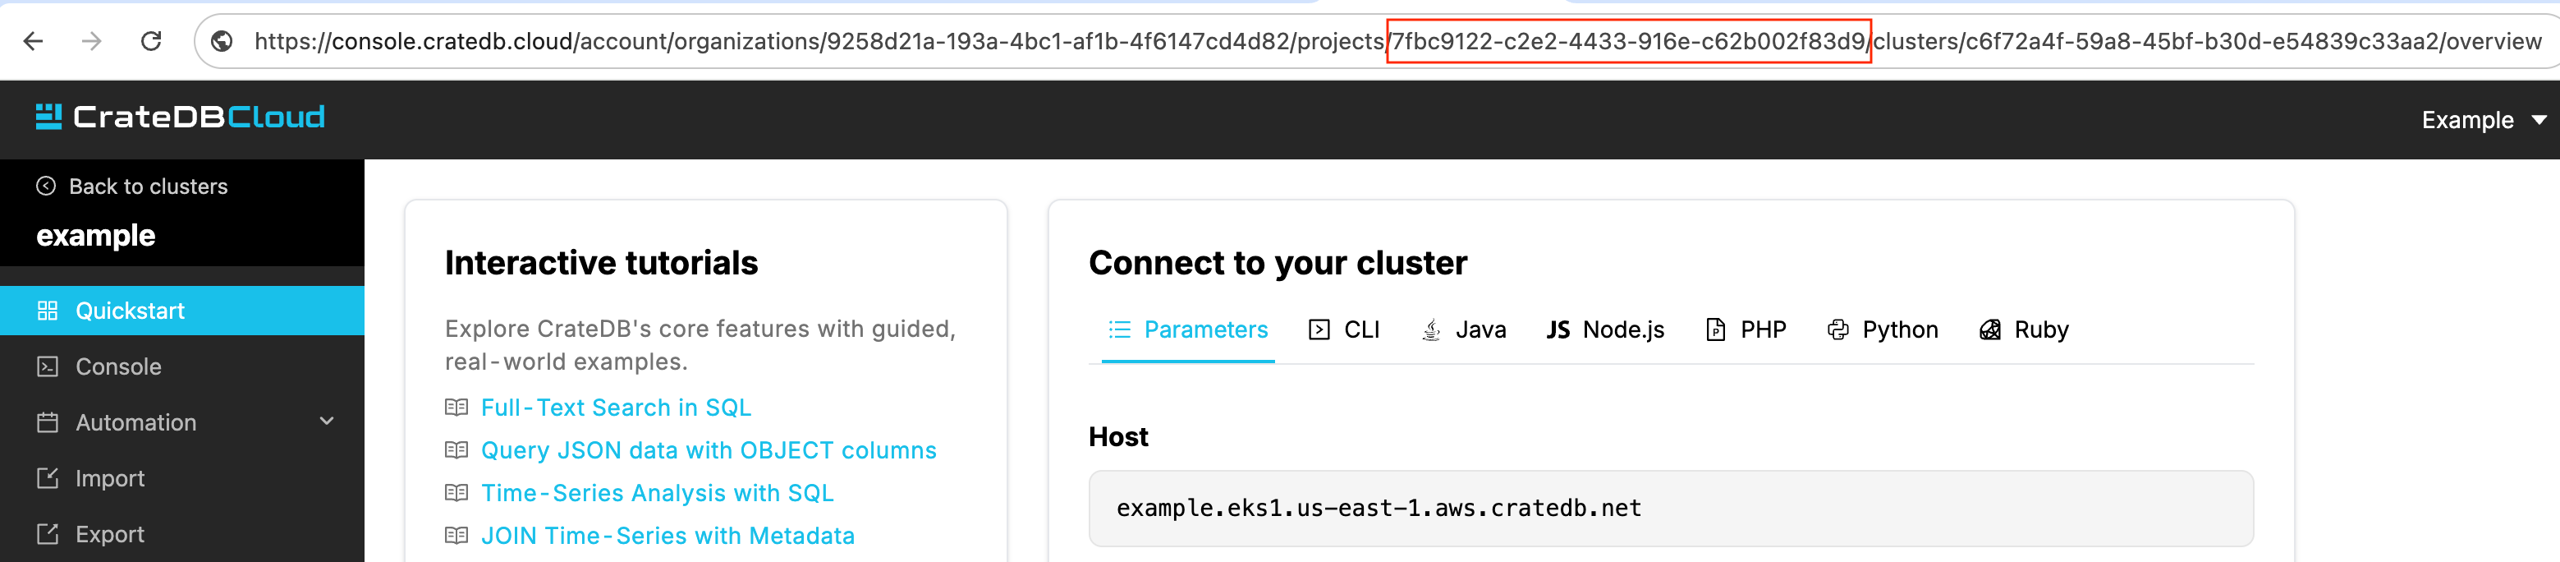
<CrateDB username>: The username to access CrateDB with, in our examplesql_exporter.<CrateDB password>: The corresponding password, in our example....<CrateDB hostname>: The hostname of your CrateDB cluster without any protocol or port, such asexample.eks1.us-east-1.aws.cratedb.net.<Project ID>: Every CrateDB Cloud cluster runs inside a project. We will need this ID to correlatesql_exportermetrics with those from the CrateDB Cloud API. You can retrieve the project ID from the URL in the Cloud Console. Navigate to the cluster’s overview page to see the right URL. You can also obtain the project ID using the expressionURL.parse(window.location).pathname.split('/')[5]in your browser’s JavaScript console from that page.The
cratedb_clusterlabel must match the project identifier used by the CrateDB Cloud metrics so both metric sources can be correlated within Grafana.
If you are running multiple CrateDB clusters in your organisation, add another entry to the jobs section for every cluster.
This option is suitable if the following conditions apply to your setup:
You are operating a self-managed environment (i.e. not CrateDB Cloud)
CrateDB is running directly on a VM or bare-metal host.
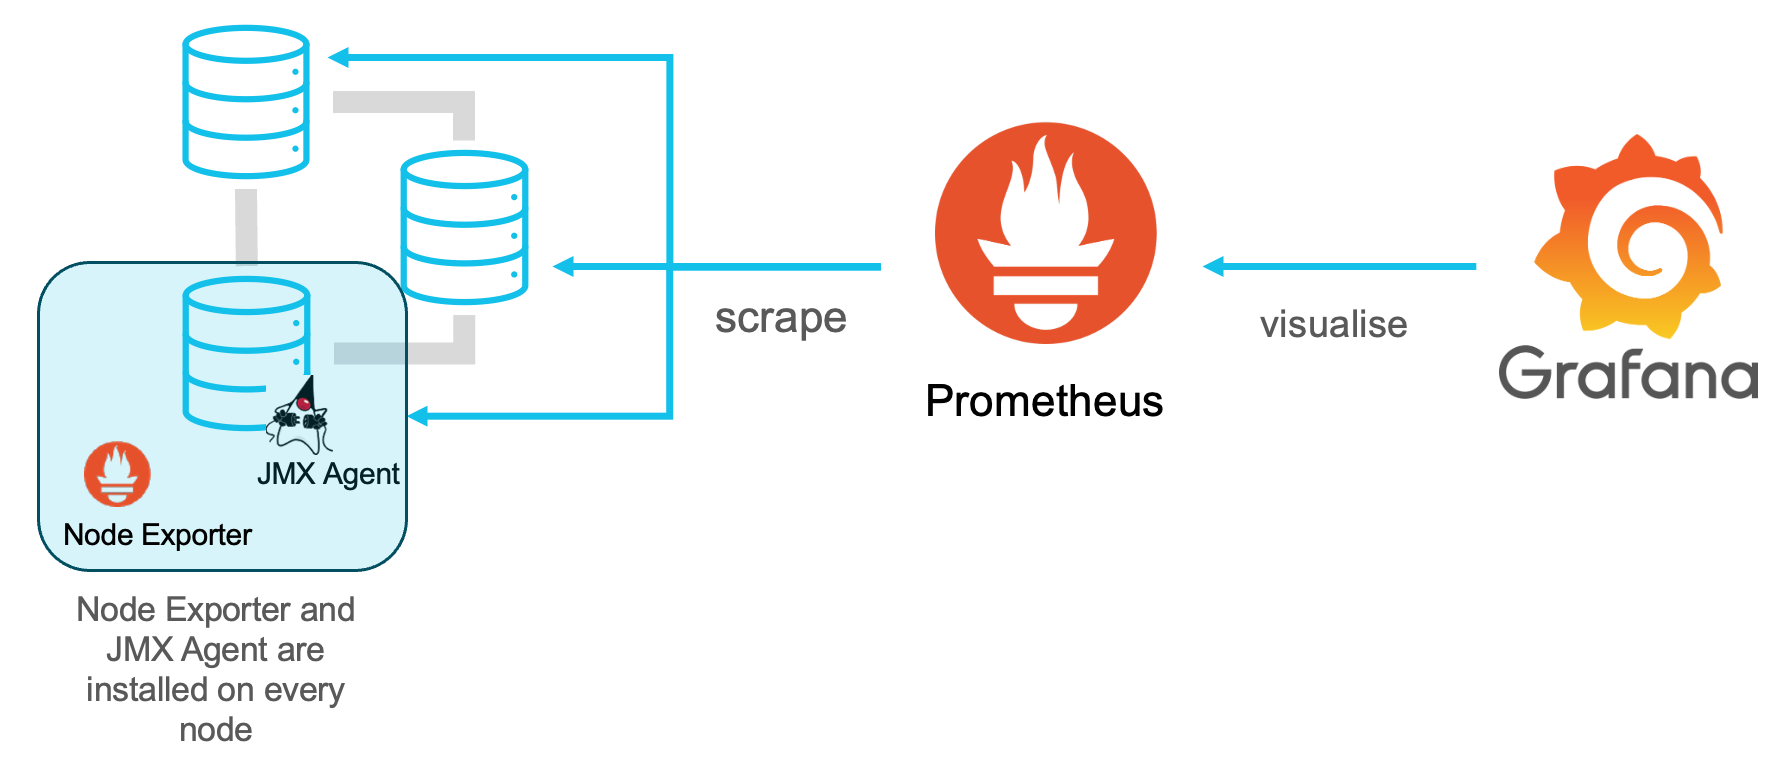
The Node Exporter captures host-wide metrics, such as CPU utilisation or memory usage. If you are running other services on the same host, be aware that Node Exporter will not be able to distinguish between the different services and certain metrics will reflect usage of the host in full. For the most accurate infrastructure metrics, CrateDB should ideally run on dedicated hosts.
Also note that when running CrateDB inside Docker containers on a shared host, Node Exporter metrics reflect the entire host rather than individual containers.
Setup Steps
This section guides you through the Node Exporter-specific setup steps and prerequisites.
Prometheus Node Exporter
Install the Prometheus Node Exporter on all CrateDB nodes.
For example, on Ubuntu:
apt-get install prometheus-node-exporter
systemctl enable prometheus-node-exporter
systemctl start prometheus-node-exporter
Ensure port 9100 is reachable on all CrateDB nodes from your Prometheus instance.
JMX Exporter
The JMX Exporter captures database-specific metrics and needs to be added to all CrateDB nodes. Please repeat the steps below for every node:
Download the latest JAR file from https://repo1.maven.org/maven2/io/crate/crate-jmx-exporter/ (e.g.
crate-jmx-exporter-1.2.4.jar).Add the line below to your
/etc/default/crate. Adjust the path according to your download destination./usr/share/crate/reflects the standard installation path for DEB and RPM packages.CRATE_JAVA_OPTS="-javaagent:/usr/share/crate/crate-jmx-exporter-1.2.4.jar=8080"
Restart the CrateDB service (
systemctl restart crate).
Ensure port 8080 is reachable on all CrateDB nodes from your Prometheus instance.
Prometheus
Add an entry to the scrape_configs section in /etc/prometheus/prometheus.yaml:
scrape_configs:
  - job_name: "node_exporter"
    scrape_interval: 15s
    static_configs:
      - targets: ["<CrateDB node 1>:9100", "<CrateDB node 2>:9100", ...]
        labels:
          cratedb_cluster: <CrateDB cluster name>
    metrics_path: "/metrics"
    relabel_configs:
      - source_labels: [__address__]
        regex: "([^:]+):.*"
        target_label: cratedb_node
        replacement: "$1"

  - job_name: "jmx_metrics"
    scrape_interval: 15s
    static_configs:
      - targets: ["<CrateDB node 1>:8080", "<CrateDB node 2>:8080", ...]
        labels:
          cratedb_cluster: <CrateDB cluster name>
    relabel_configs:
      - source_labels: [__address__]
        regex: "([^:]+):.*"
        target_label: cratedb_node
        replacement: "$1"
Replace placeholders accordingly:
<CrateDB node 1>,<CrateDB node 2>,...: A list of all your CrateDB nodes. Provide the hostname or IP address.<CrateDB cluster name>: The plaintext name under which your cluster will appear in the dashboard.
Use the same scrape interval for node_exporter and jmx_metrics to simplify correlation between infrastructure and database metrics.
If you are running multiple CrateDB clusters, please create dedicated scrape configs for each cluster. For example, node_exporter_cluster_1, jmx_metrics_cluster_1, and so on.
Reload or restart Prometheus after changing the configuration (for example, systemctl restart prometheus.service).
Optional: sql_exporter
If you want to use sql_exporter for custom queries, add a jobs section to /etc/sql_exporter/sql_exporter.yml, so your configuration looks like below:
jobs:
  - job_name: db_targets
    collectors: [cratedb]
    static_configs:
      - targets:
          cratedb: "postgresql://<CrateDB username>:<CrateDB password>@<CrateDB hostname>:5432/doc"
        labels:
          cratedb_cluster: "<CrateDB cluster name>"
Replace the following placeholders:
<CrateDB username>: The username to access CrateDB with, in our examplesql_exporter.<CrateDB password>: The corresponding password, in our example....<CrateDB hostname>: The hostname of your load balancer in front of CrateDB cluster. If you don’t have a load balancer, you can also hardcode a single node’s hostname, but be aware that this may cause uneven load distribution if queries are heavy.<CrateDB cluster name>: The same cluster name as provided in the Prometheus config above.
If you are running multiple CrateDB clusters, add another entry to the jobs section for every cluster.
Dashboard import
To add the dashboard to Grafana, please follow these steps:
Download the dashboard JSON file. For Cloud users and Enterprise users, download it from your cluster’s “Quickstart” page.
Go to the “Dashboards” section
Click “New” and “Import”
Upload the dashboard JSON file you downloaded in step #1. It will ask to select a Prometheus data source, select the one you just created.
Experimental: Use with LLM-based tools (e.g. Grafana MCP)
The dashboard can be used in combination with LLM-based tools such as the Grafana MCP server to assist with exploratory analysis. However, such integrations should be considered experimental and used with caution. LLMs may misinterpret metrics, thresholds, or value semantics (for example, treating a health value of 0 as unhealthy, or flagging normal resource utilisation as problematic). To obtain reliable results, additional configuration and domain-specific context are required. Without this, findings may be incomplete or incorrect and should always be validated manually.